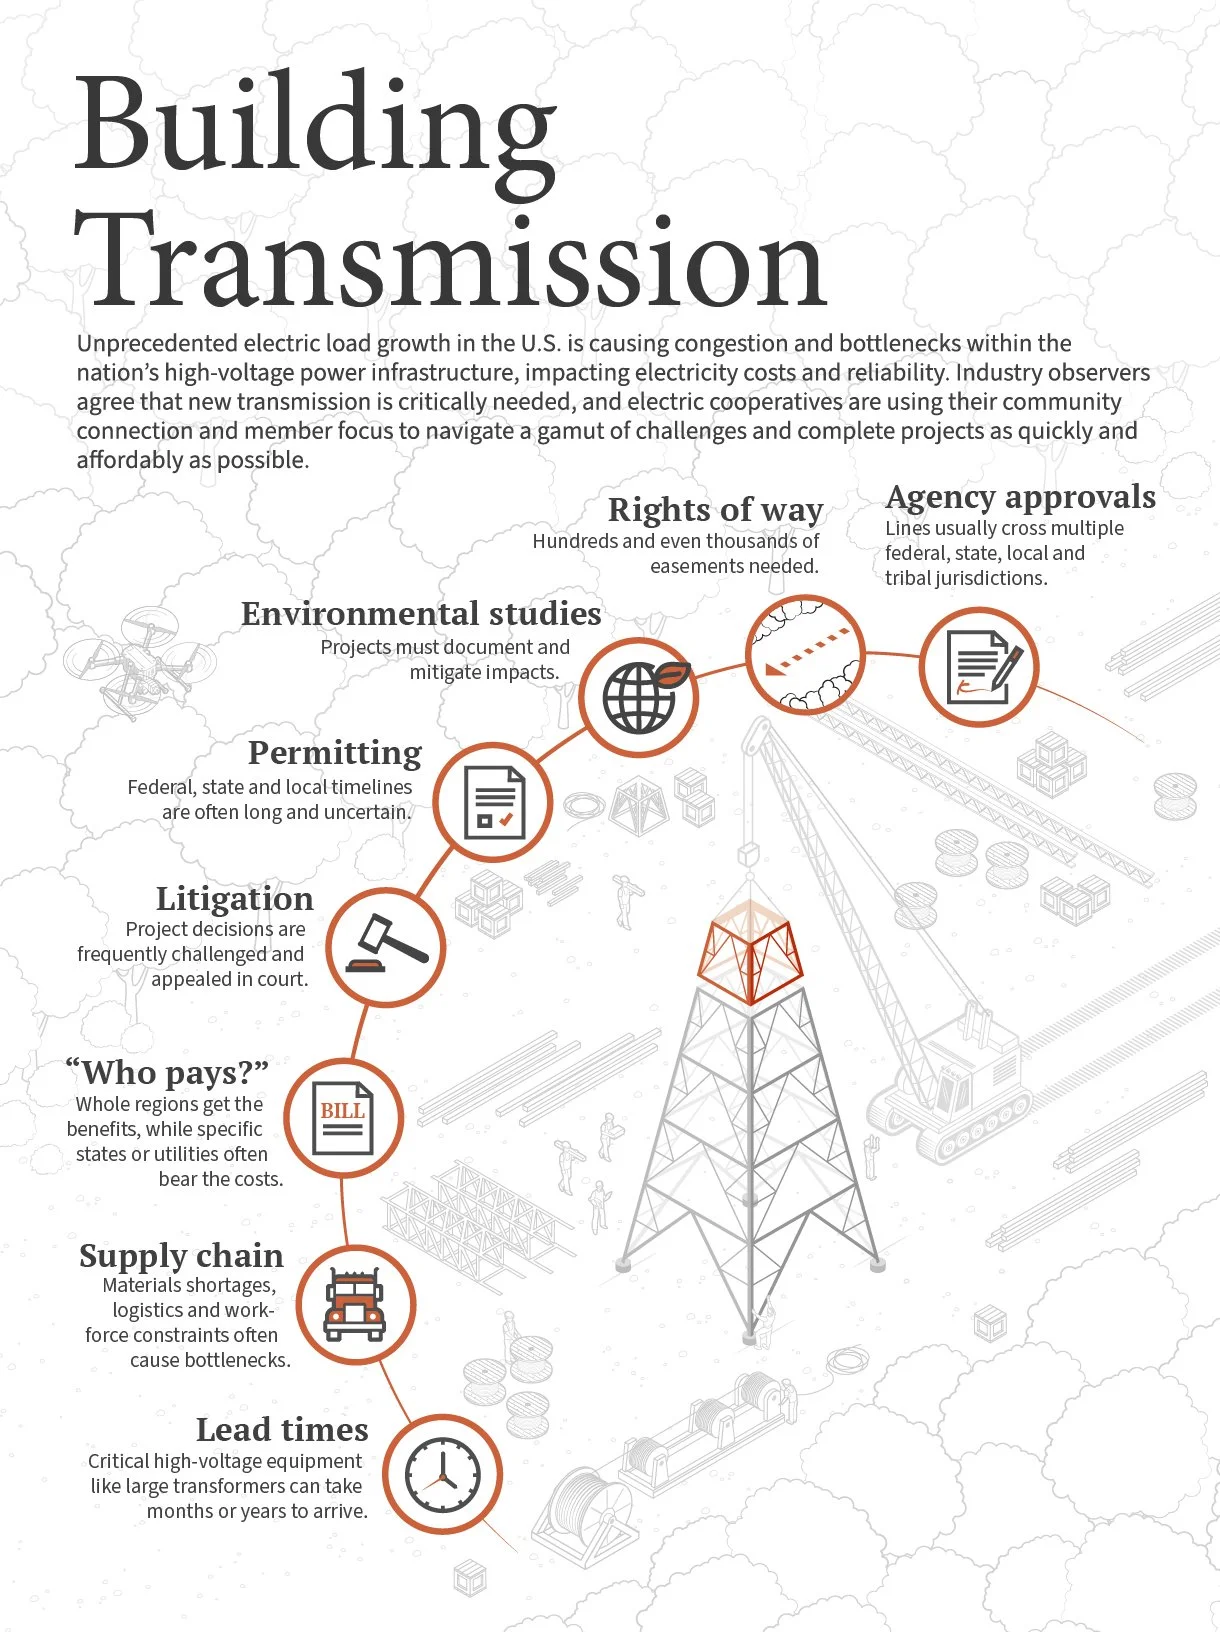
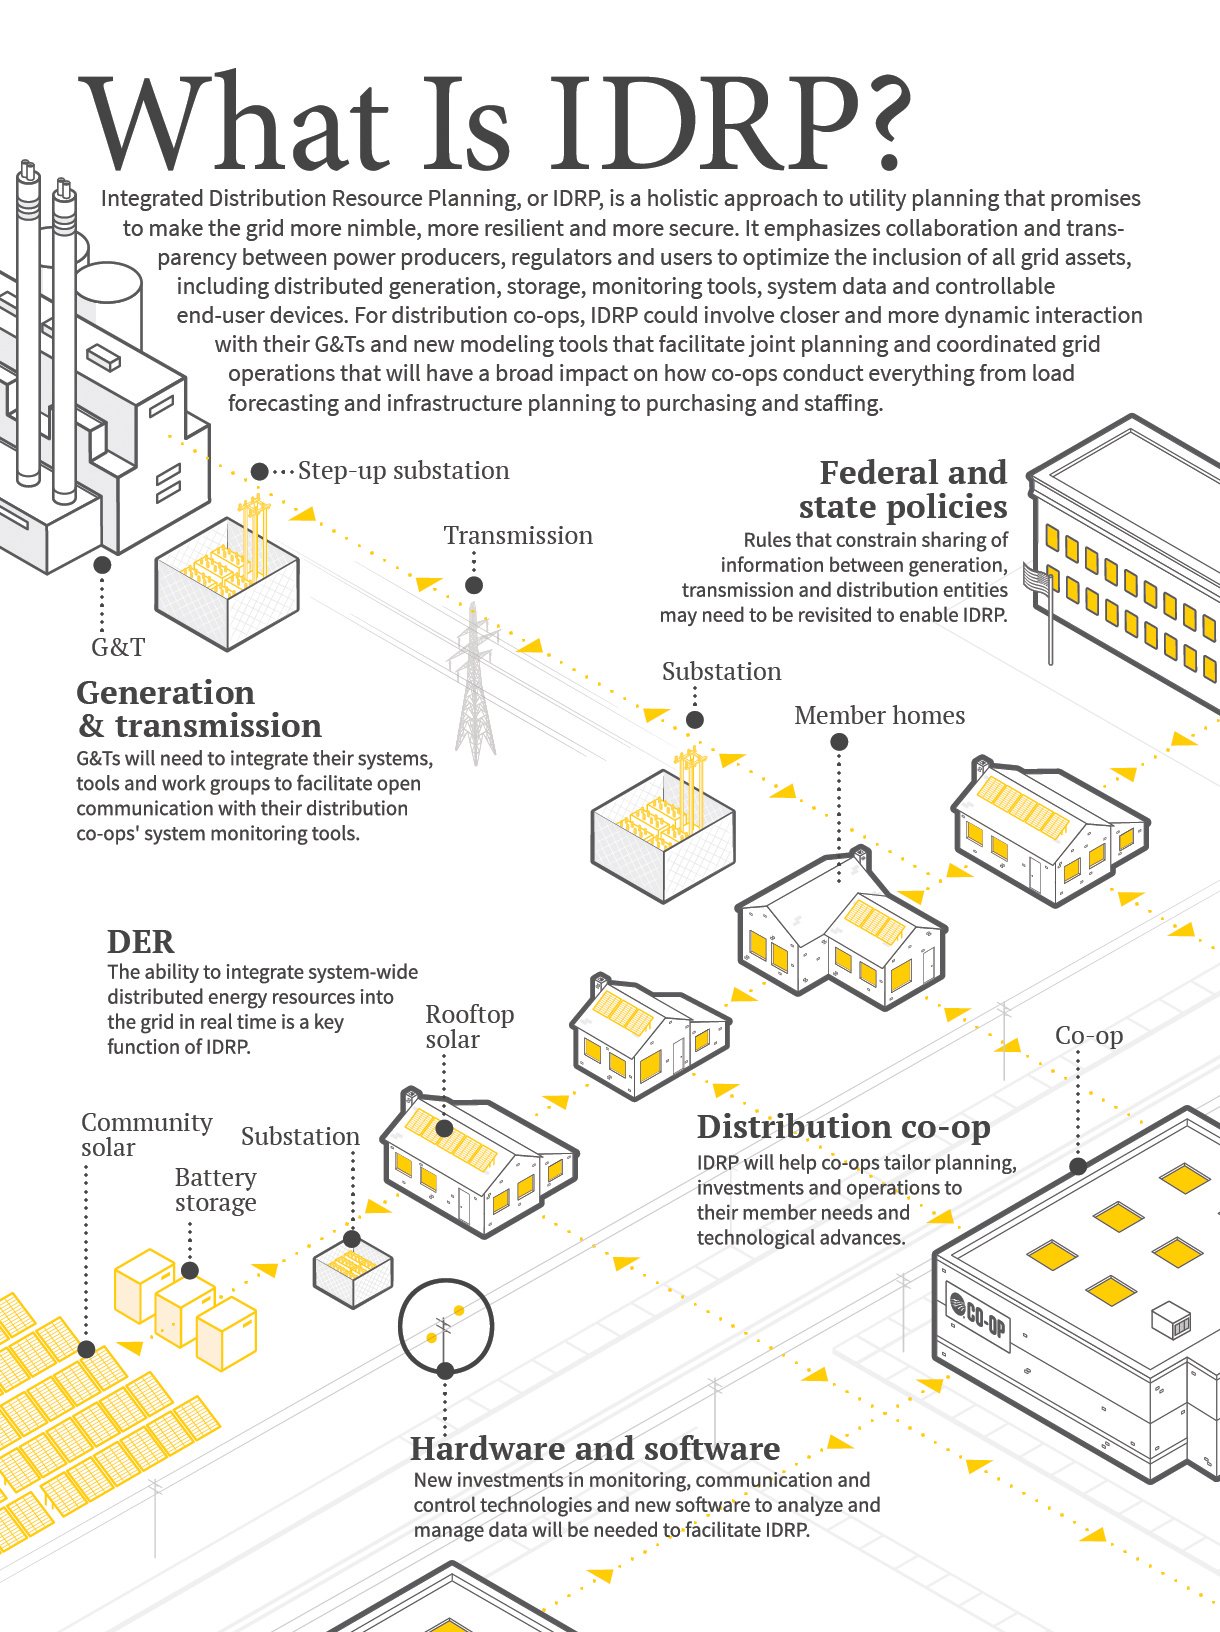
Infographic from April 2026 issue of RE Magazine
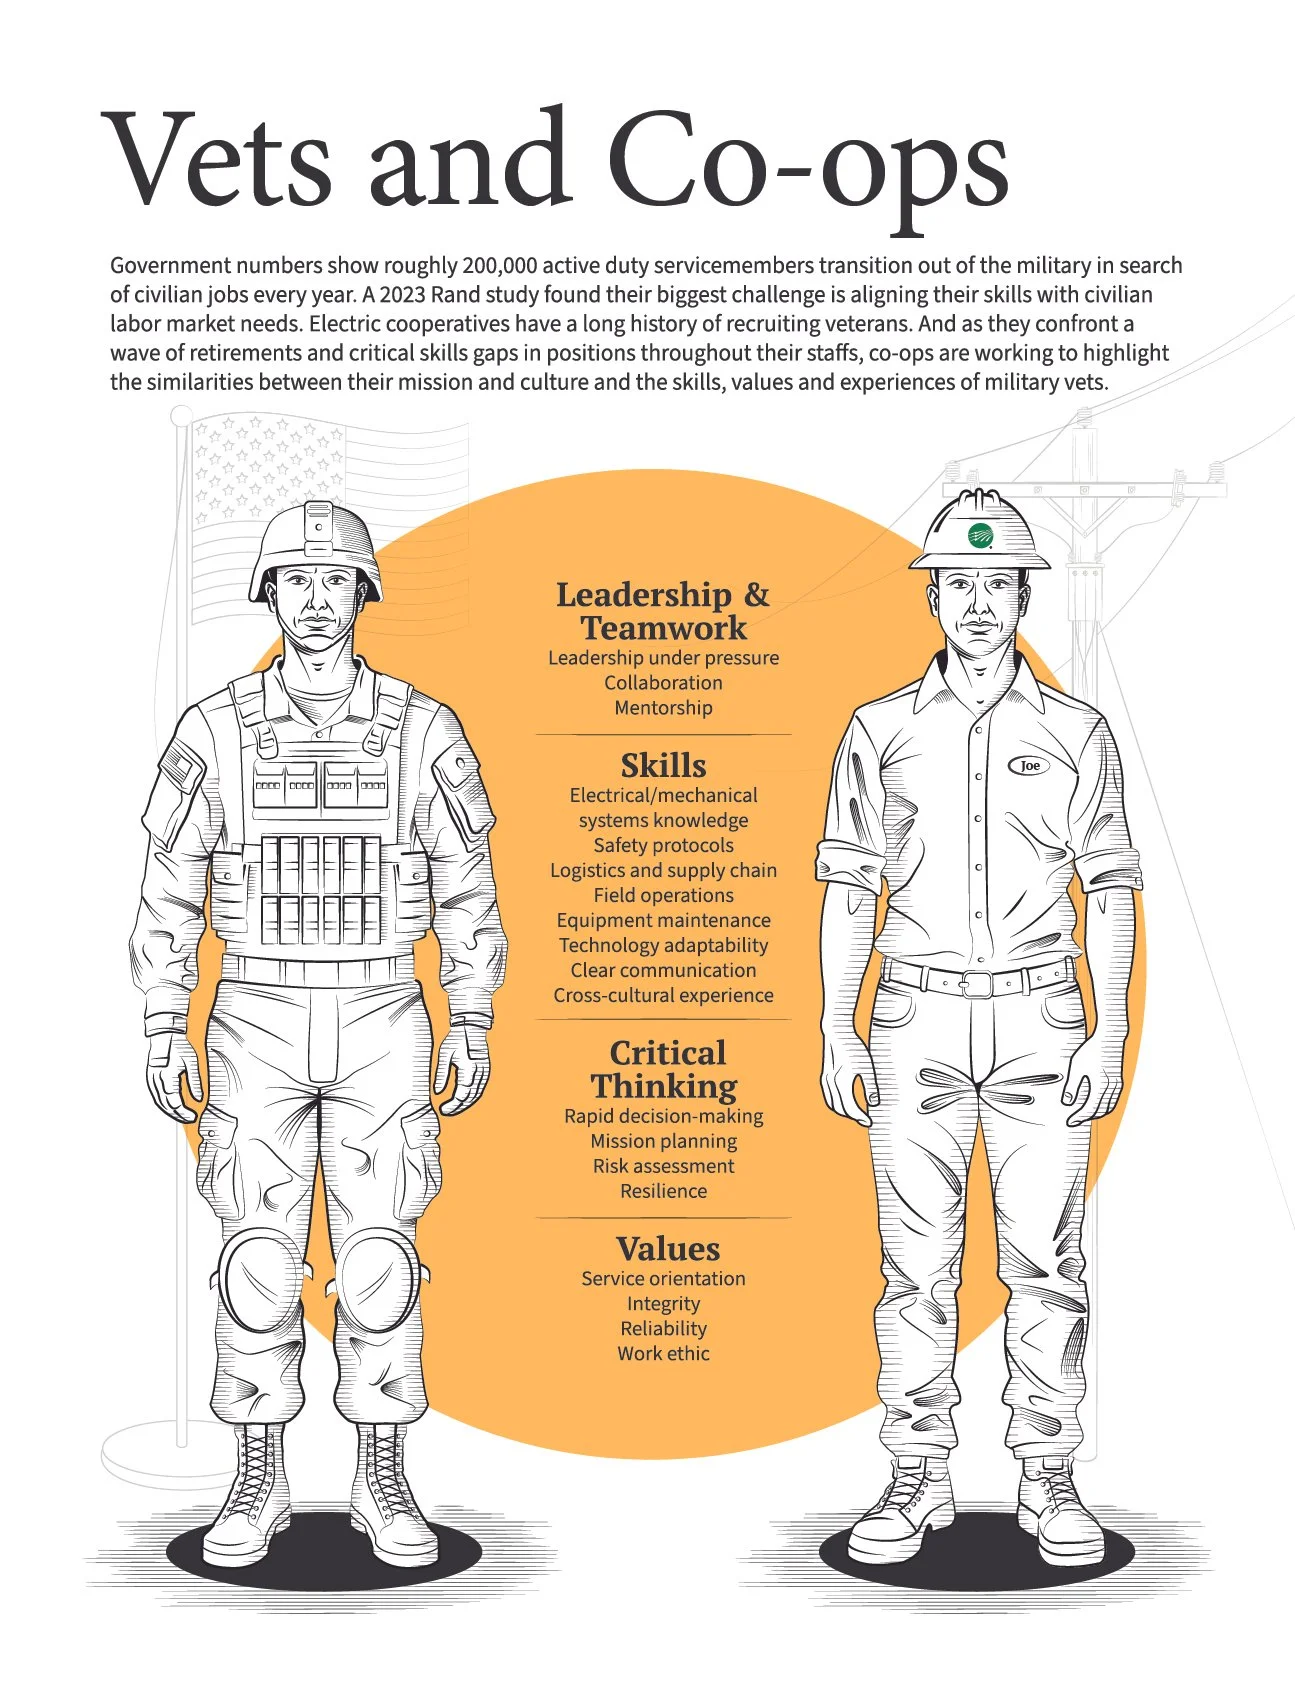
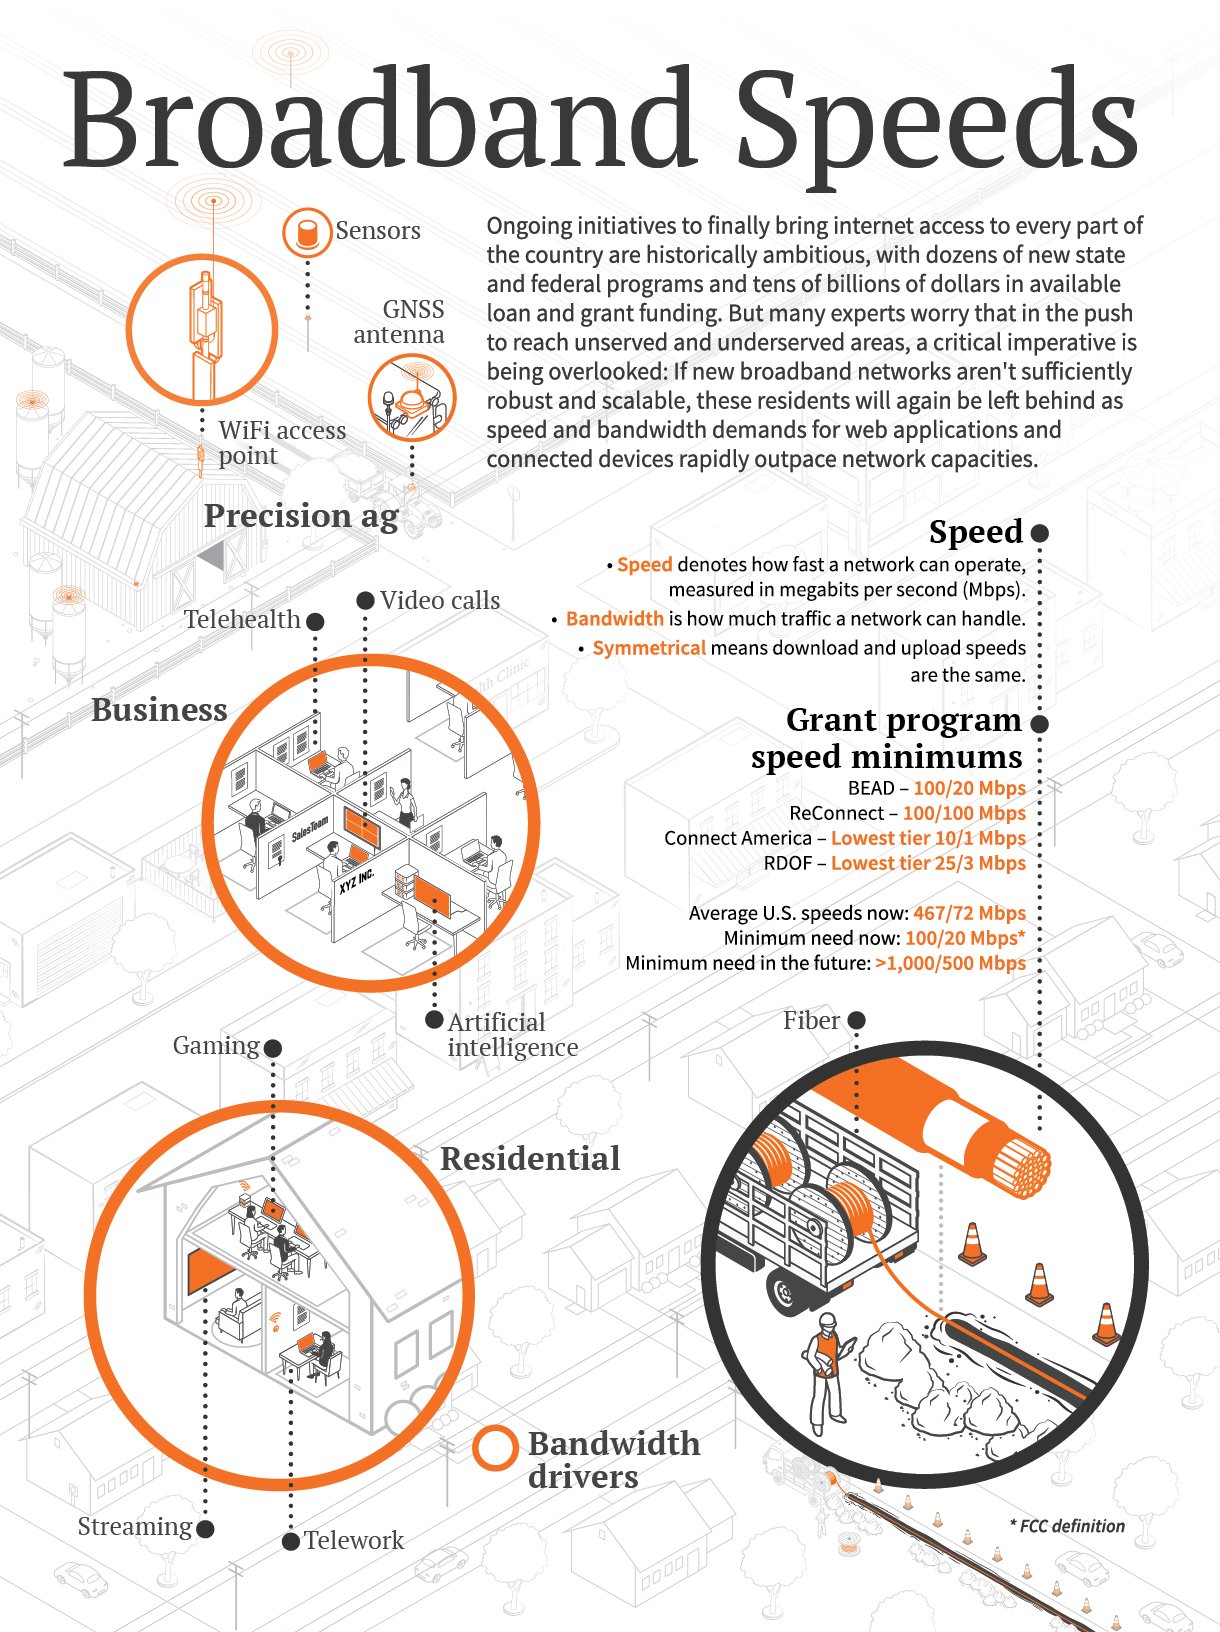
Infographic from March 2026 issue of RE Magazine
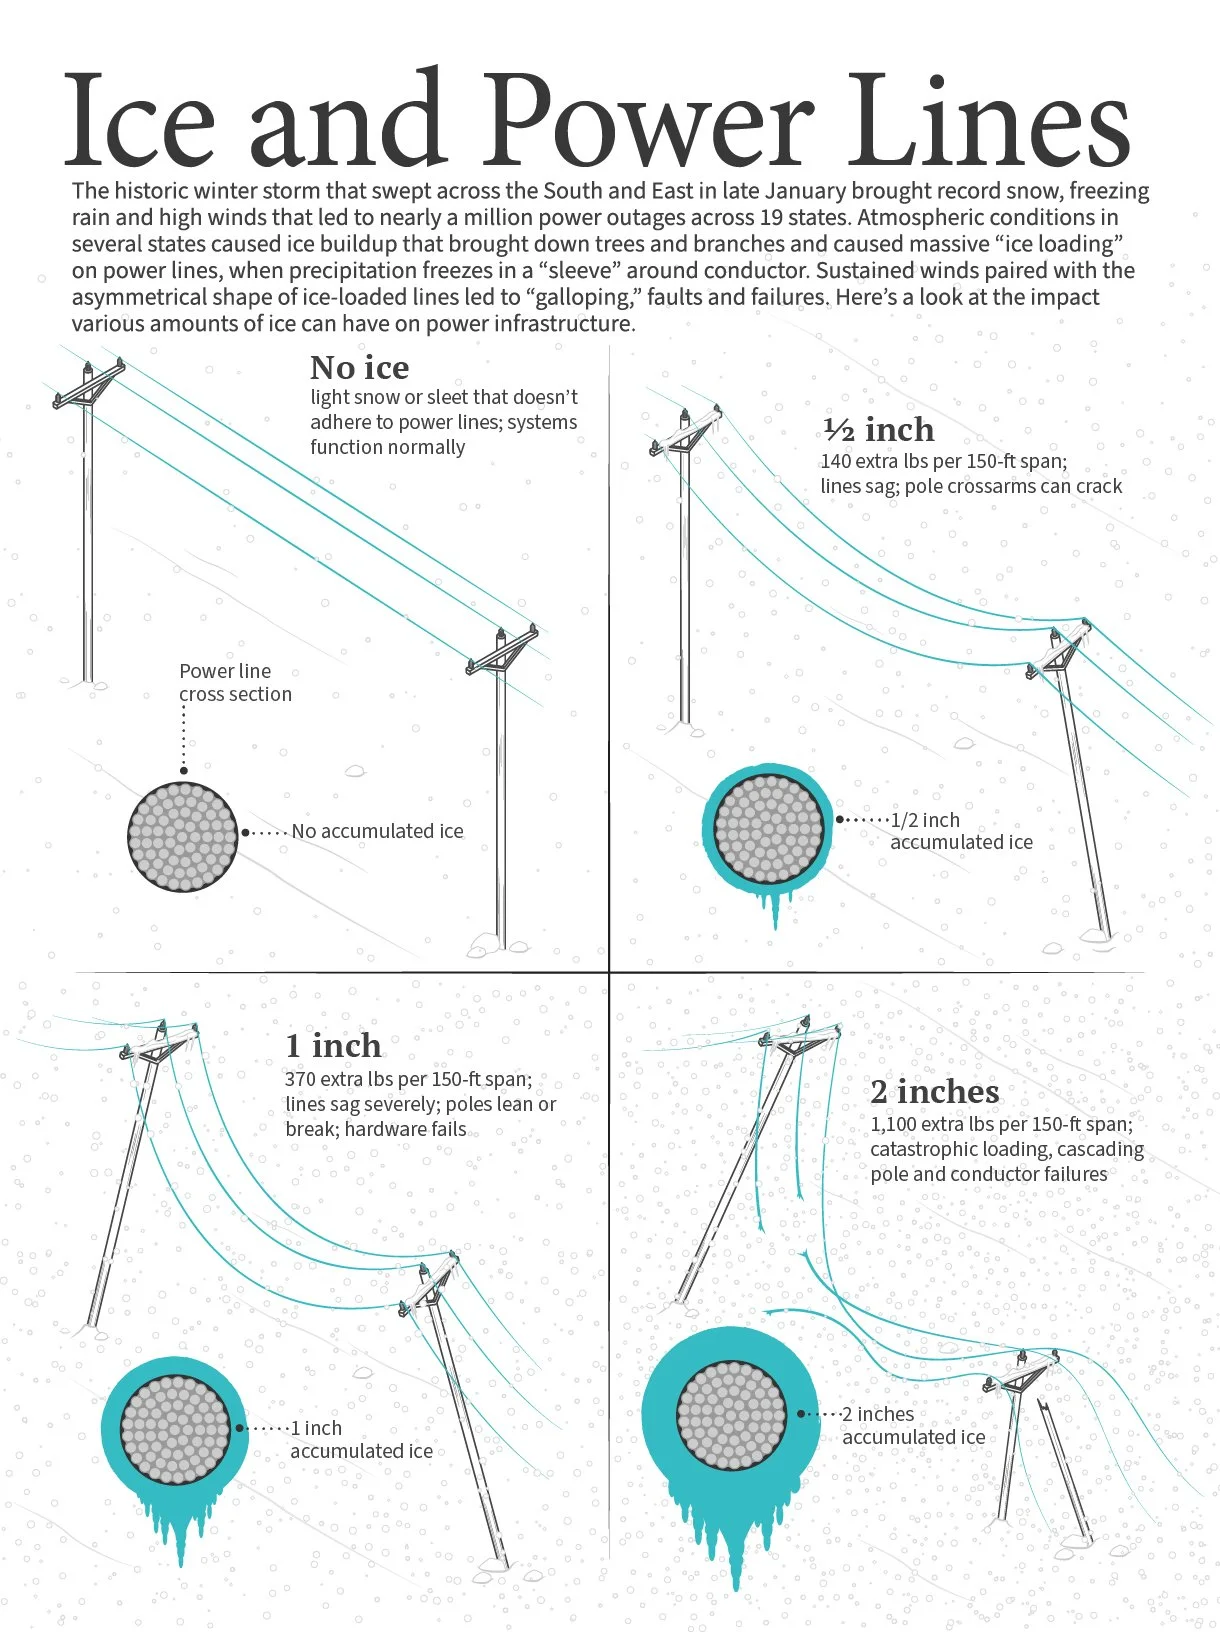
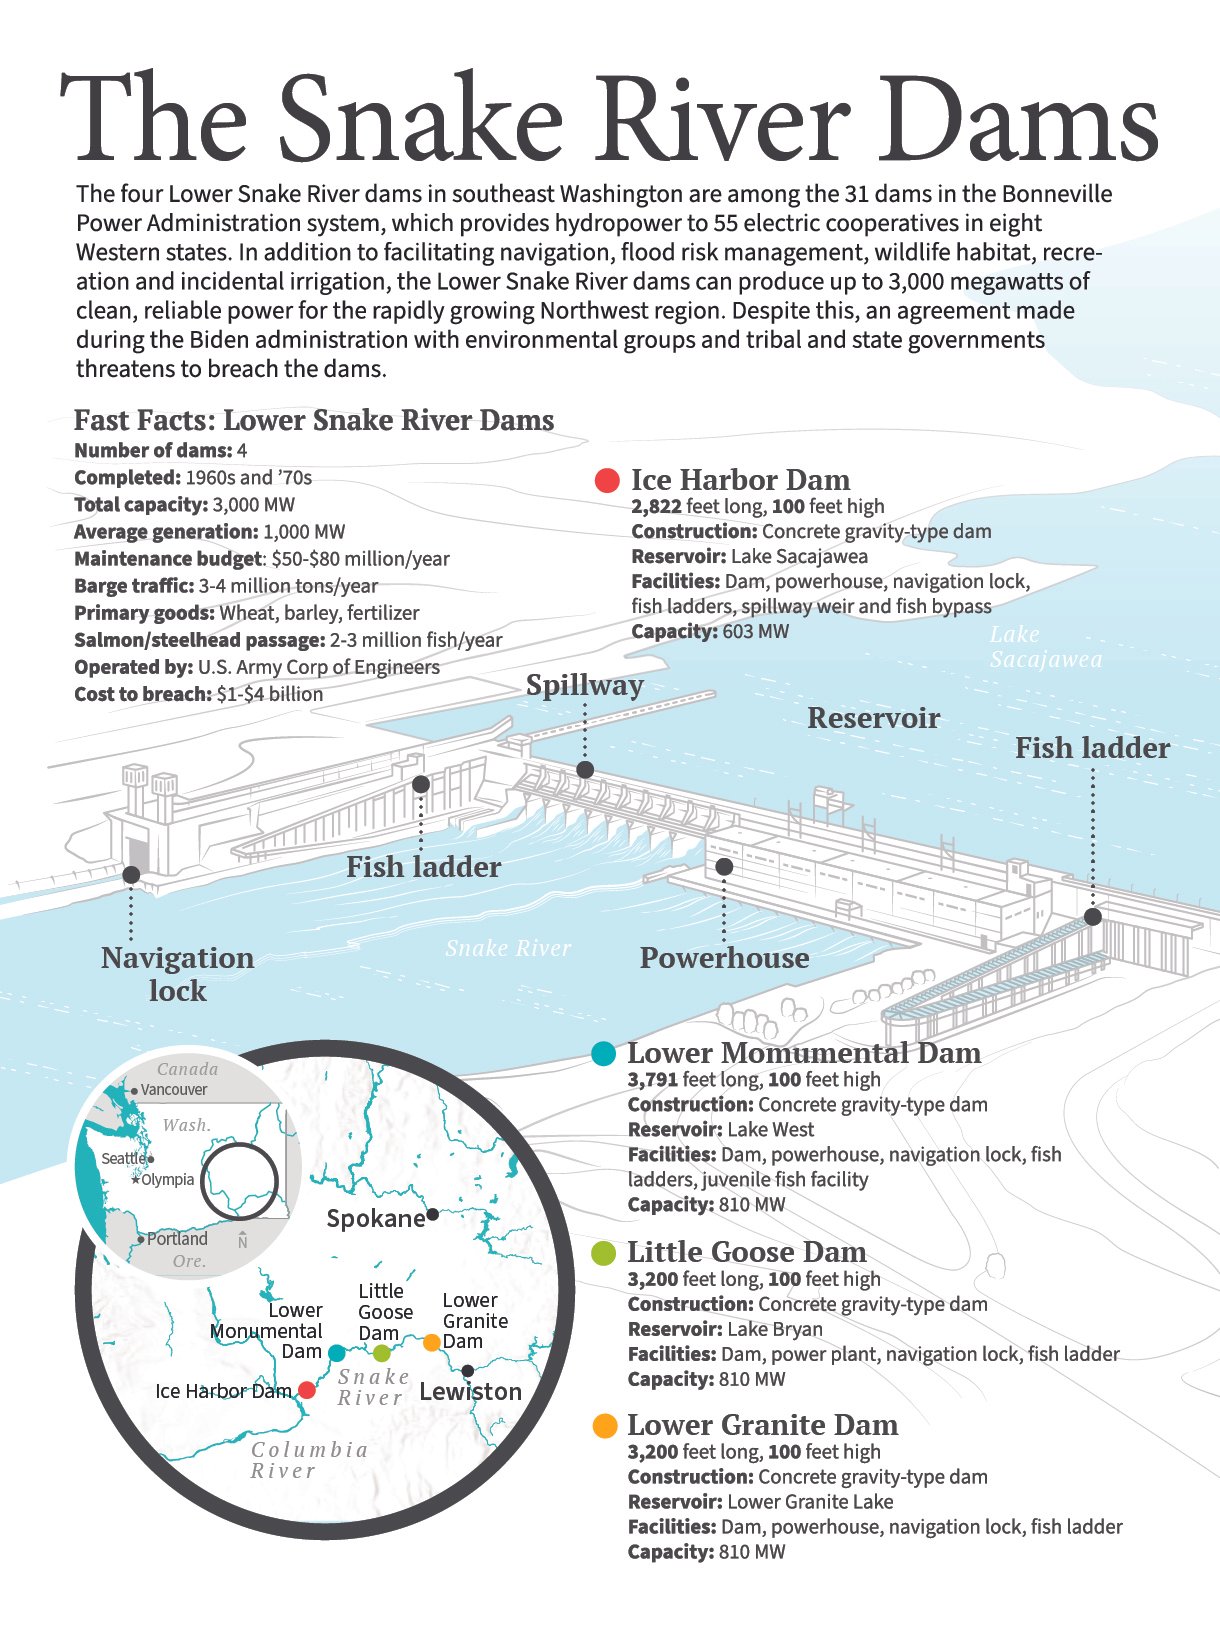
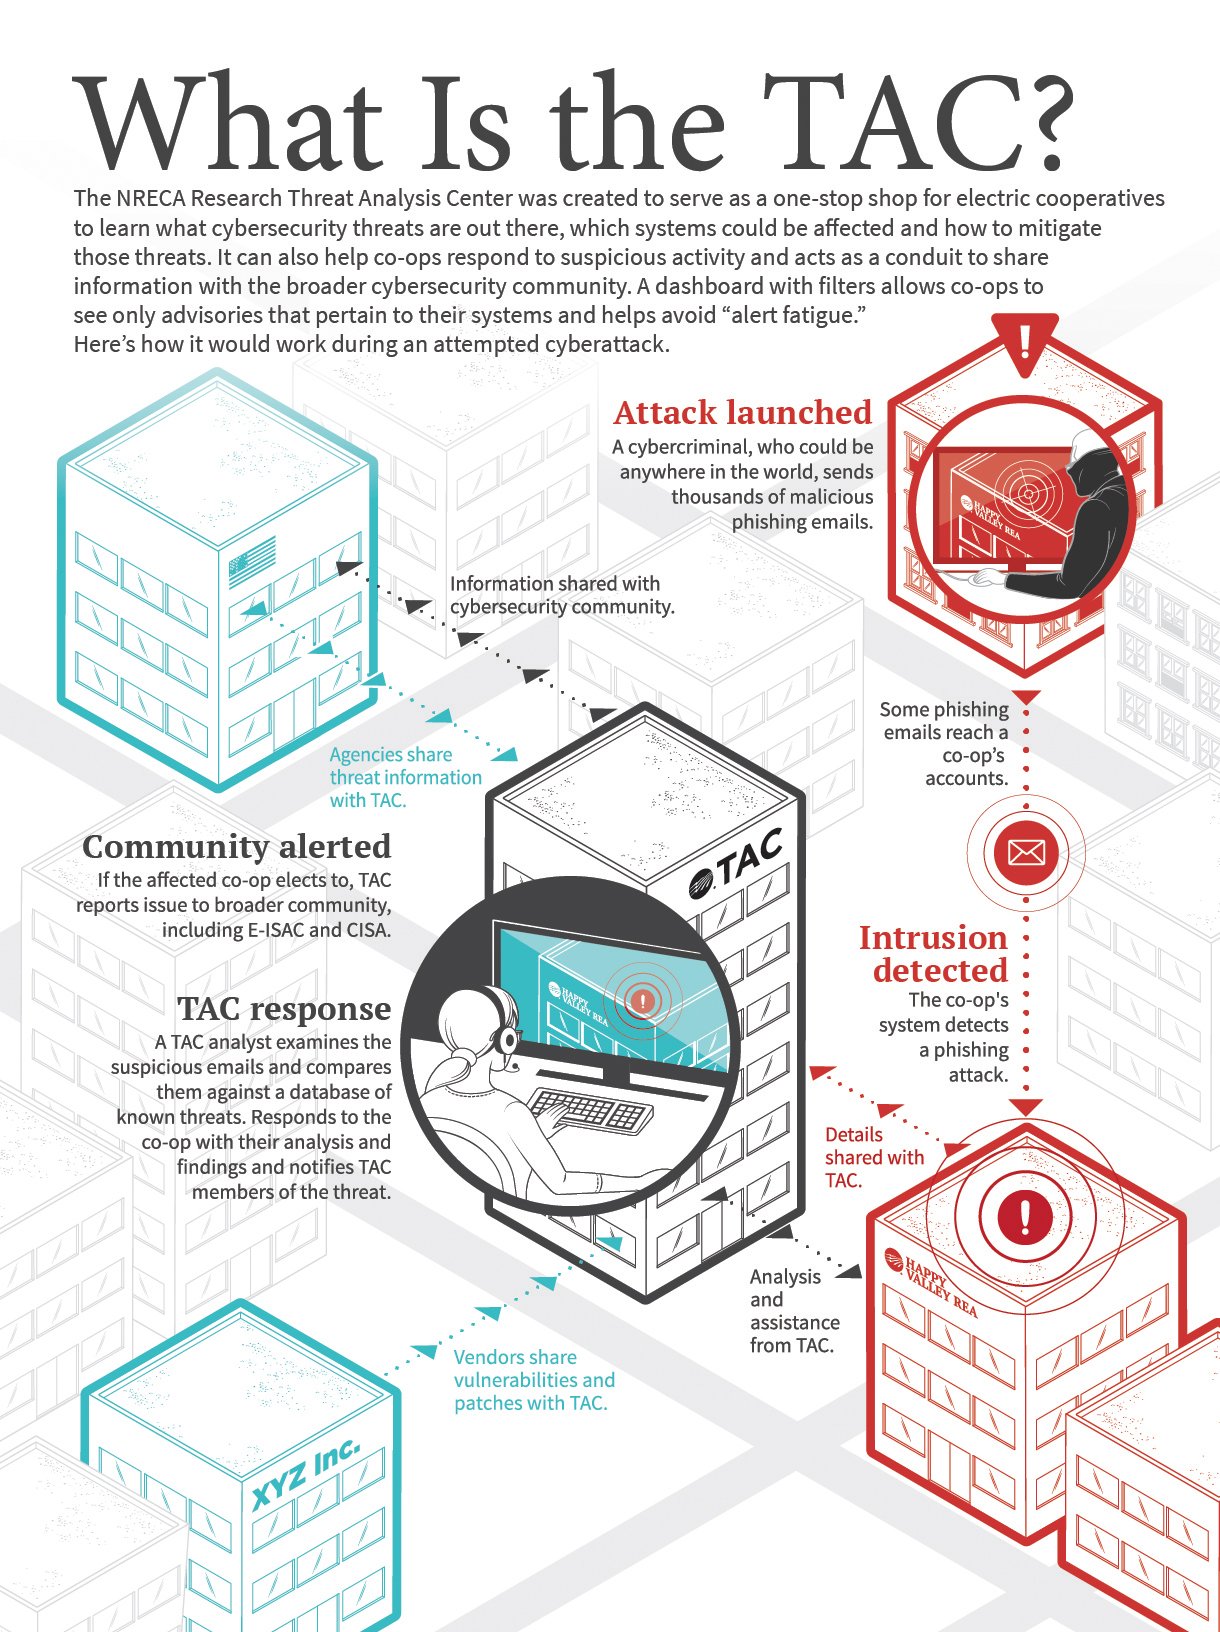
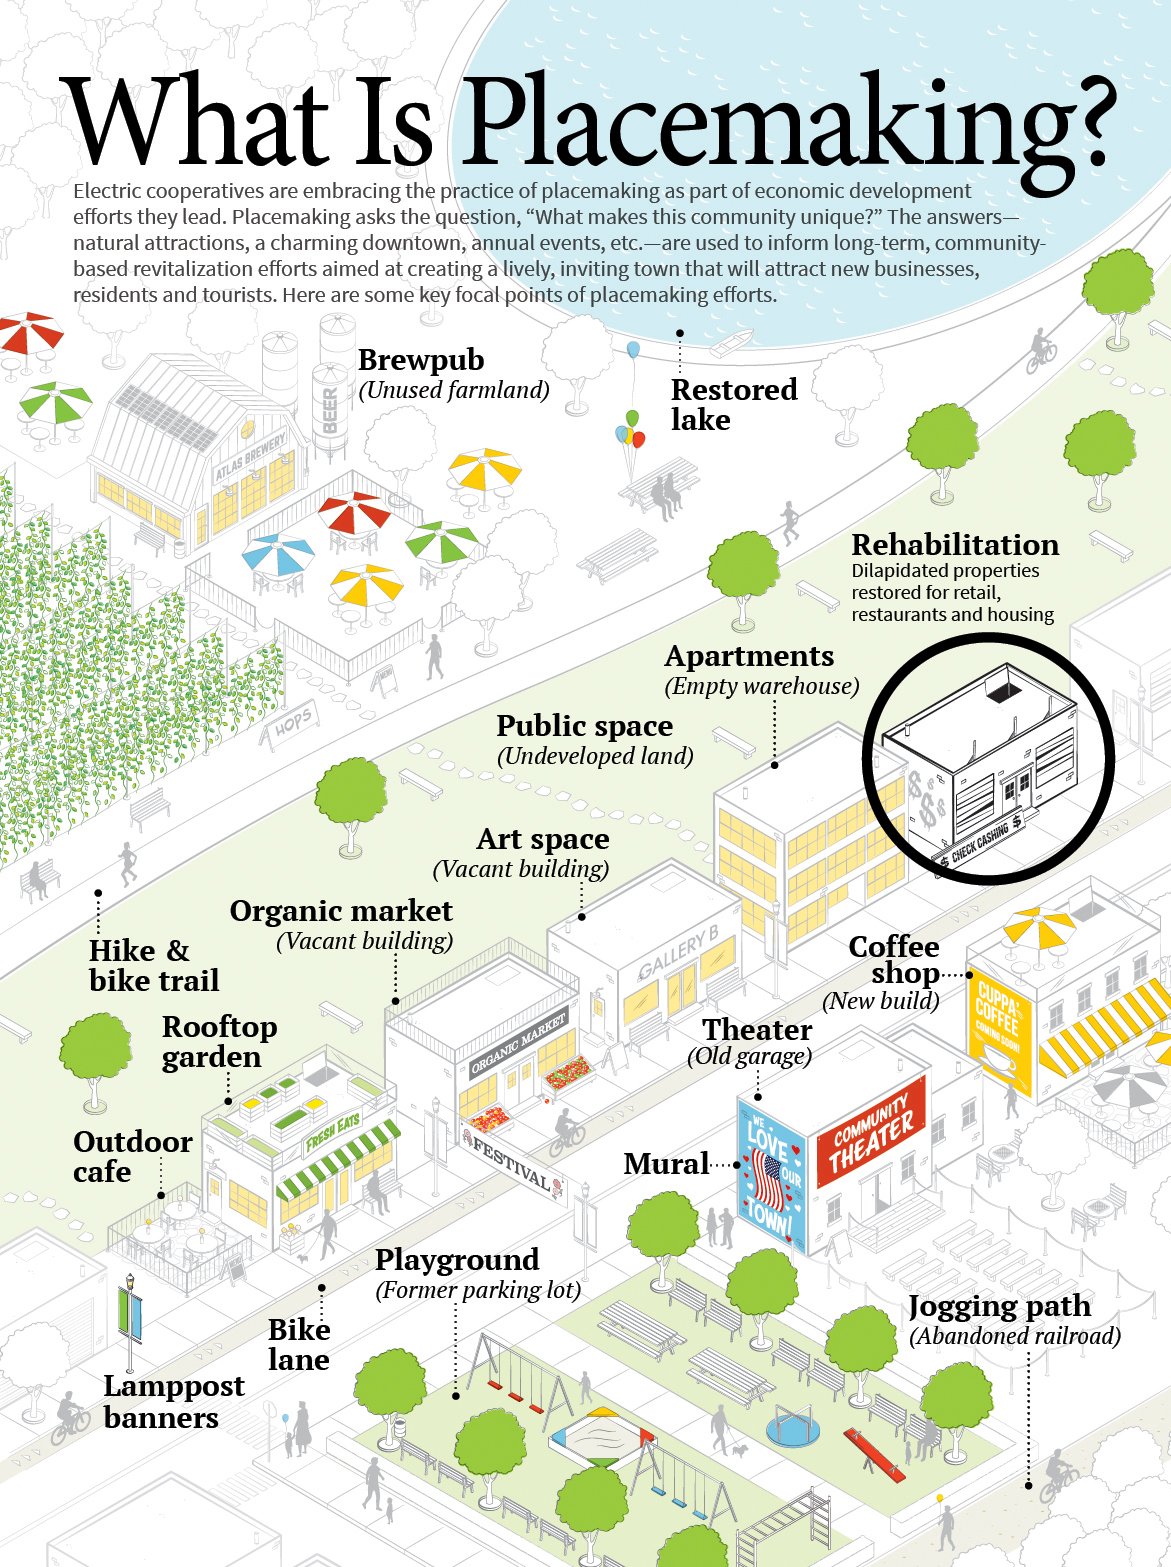
Infographic from January 2026 issue of RE Magazine
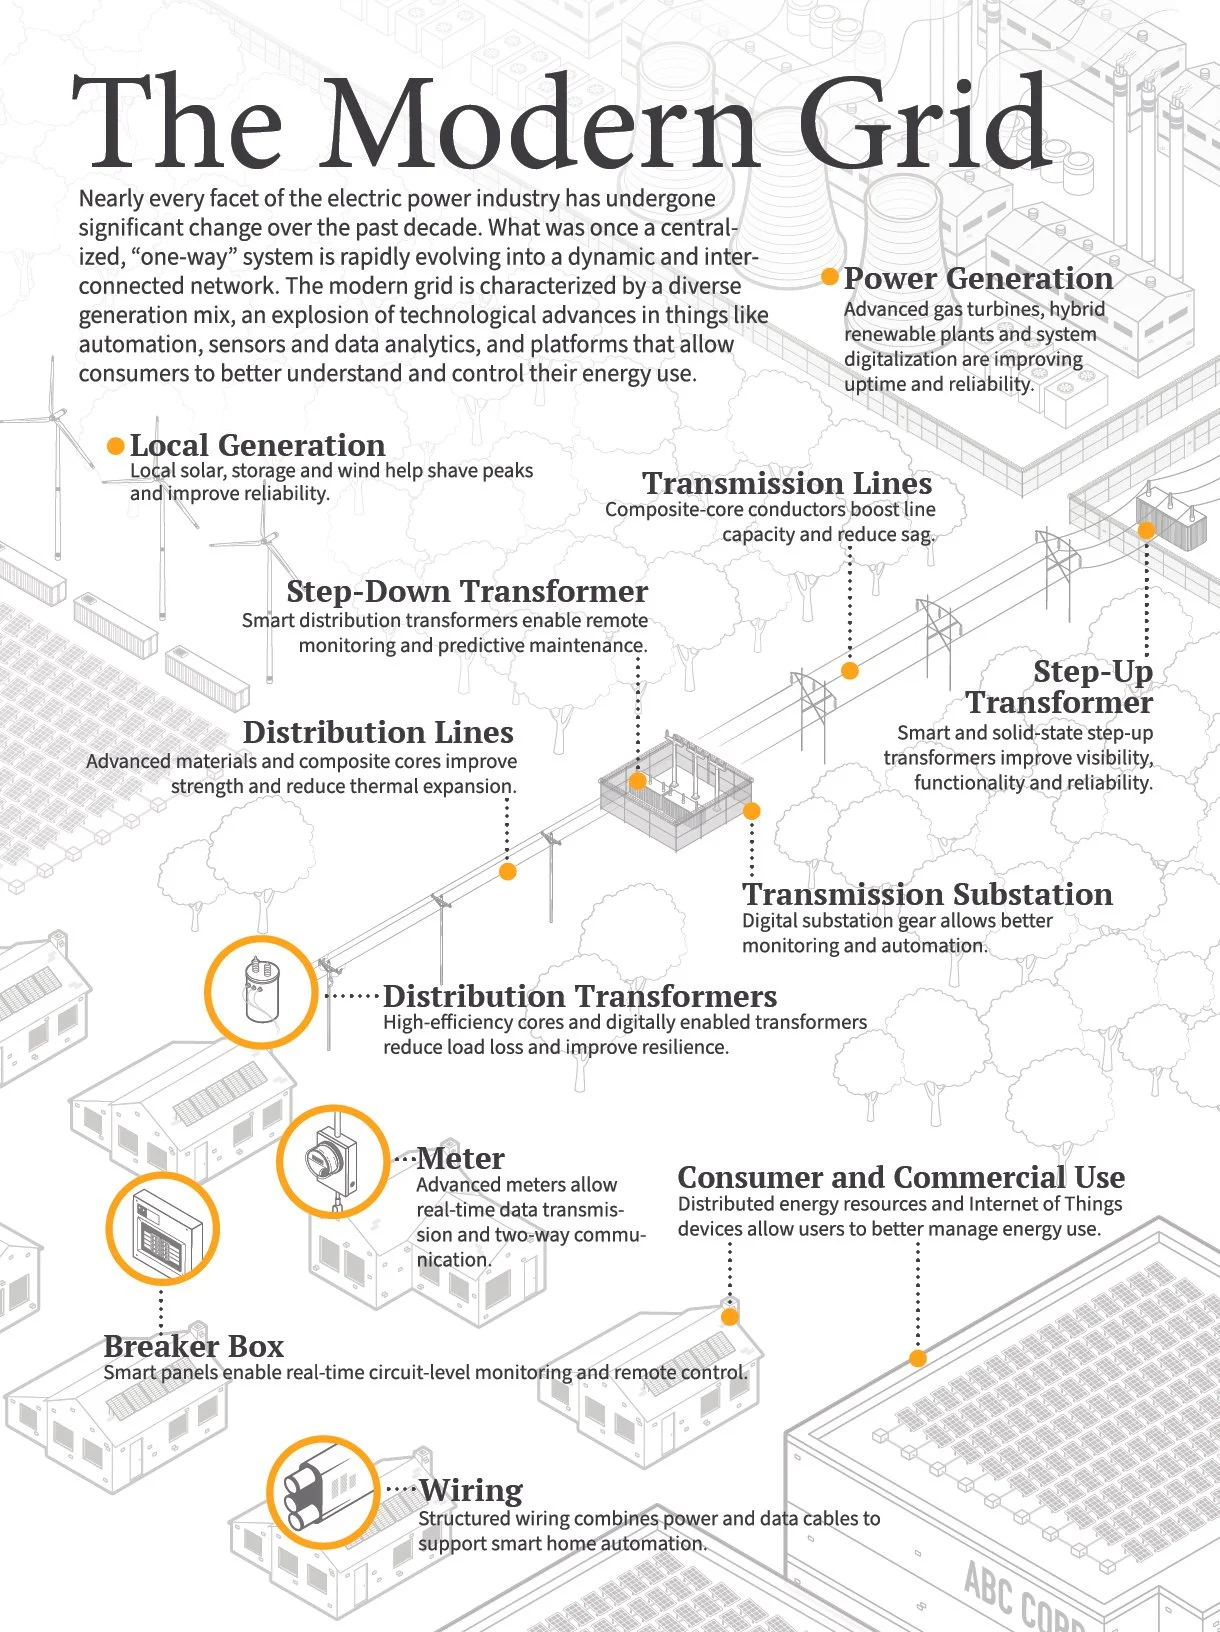
Infographic from November 2025 issue of RE Magazine
Infographic from October2025 issue of RE Magazine

Infographic from July 2025 issue of RE Magazine
Infographic from June2025 issue of RE Magazine
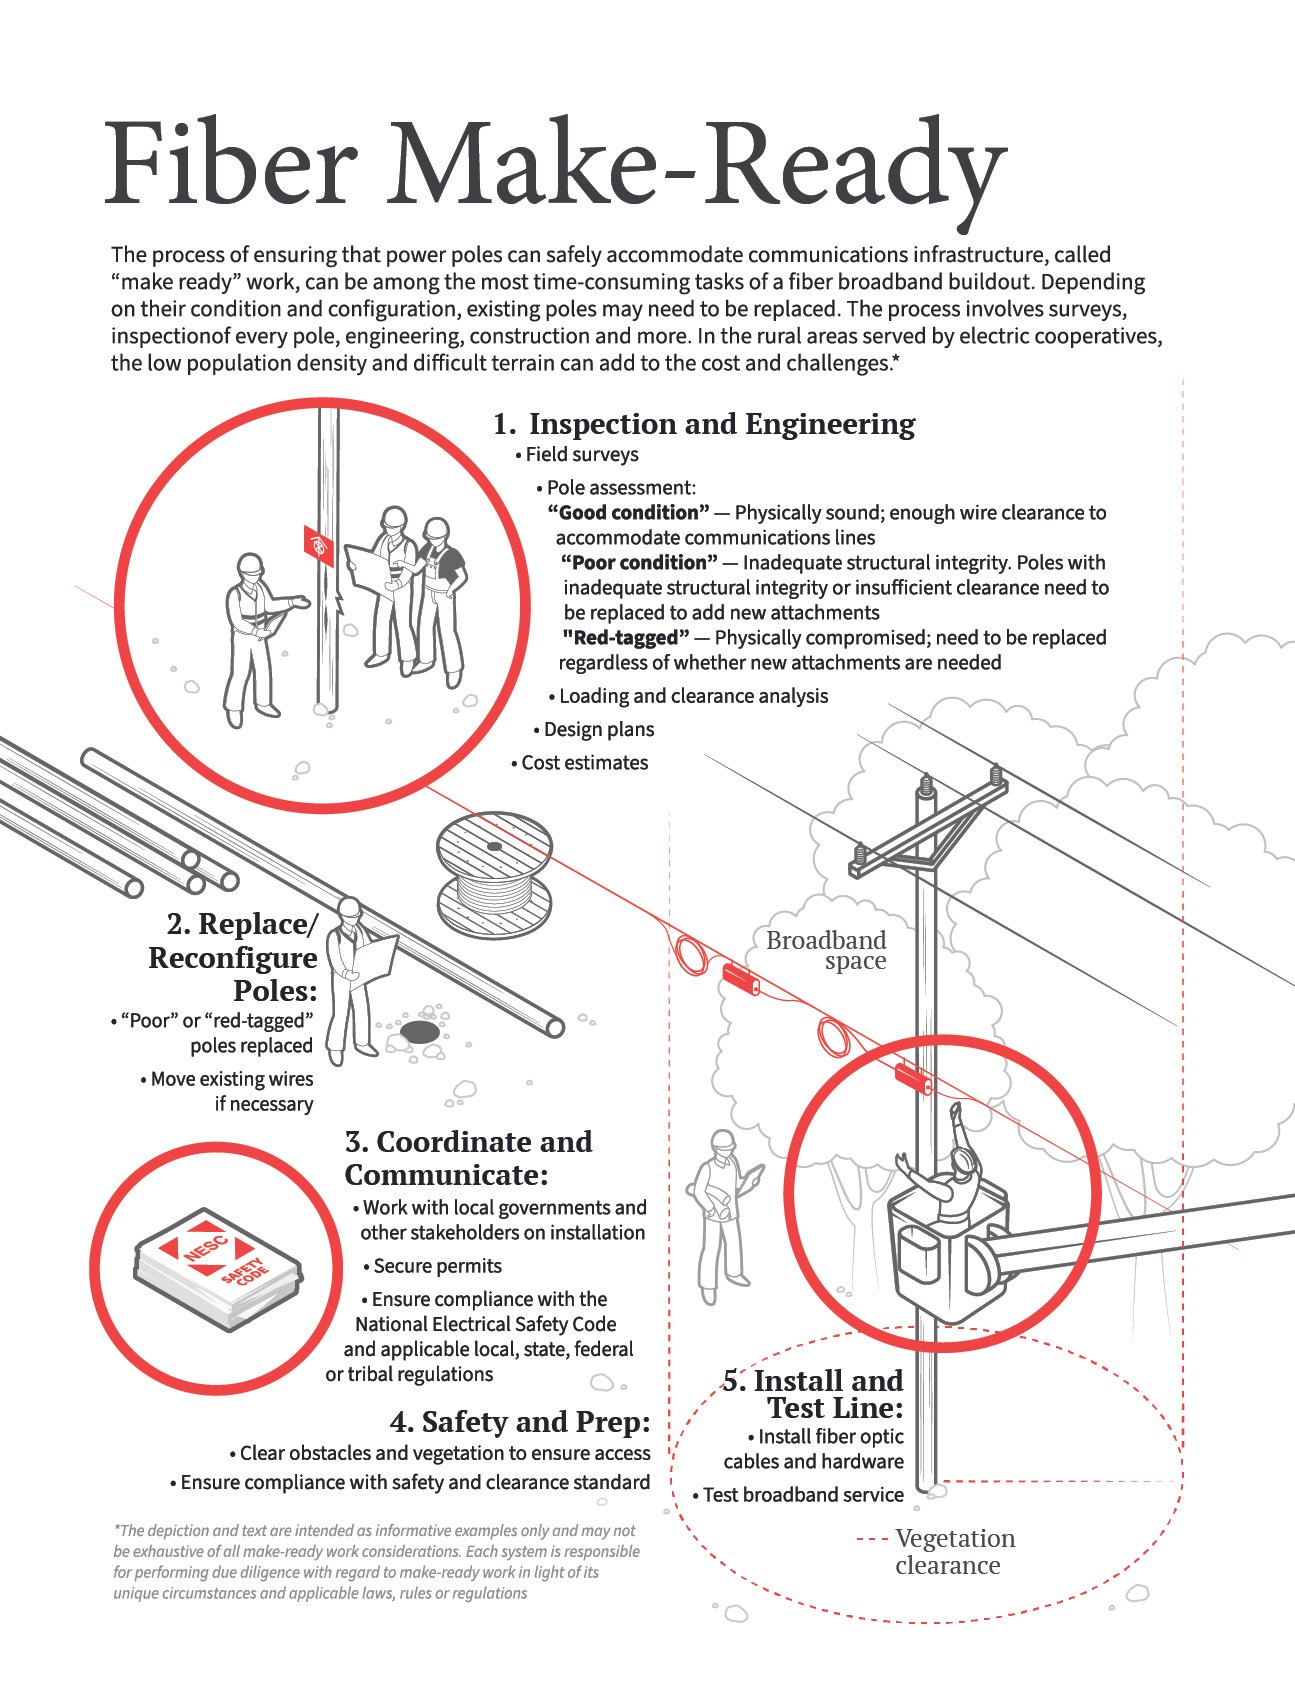
Fiber Make-Ready
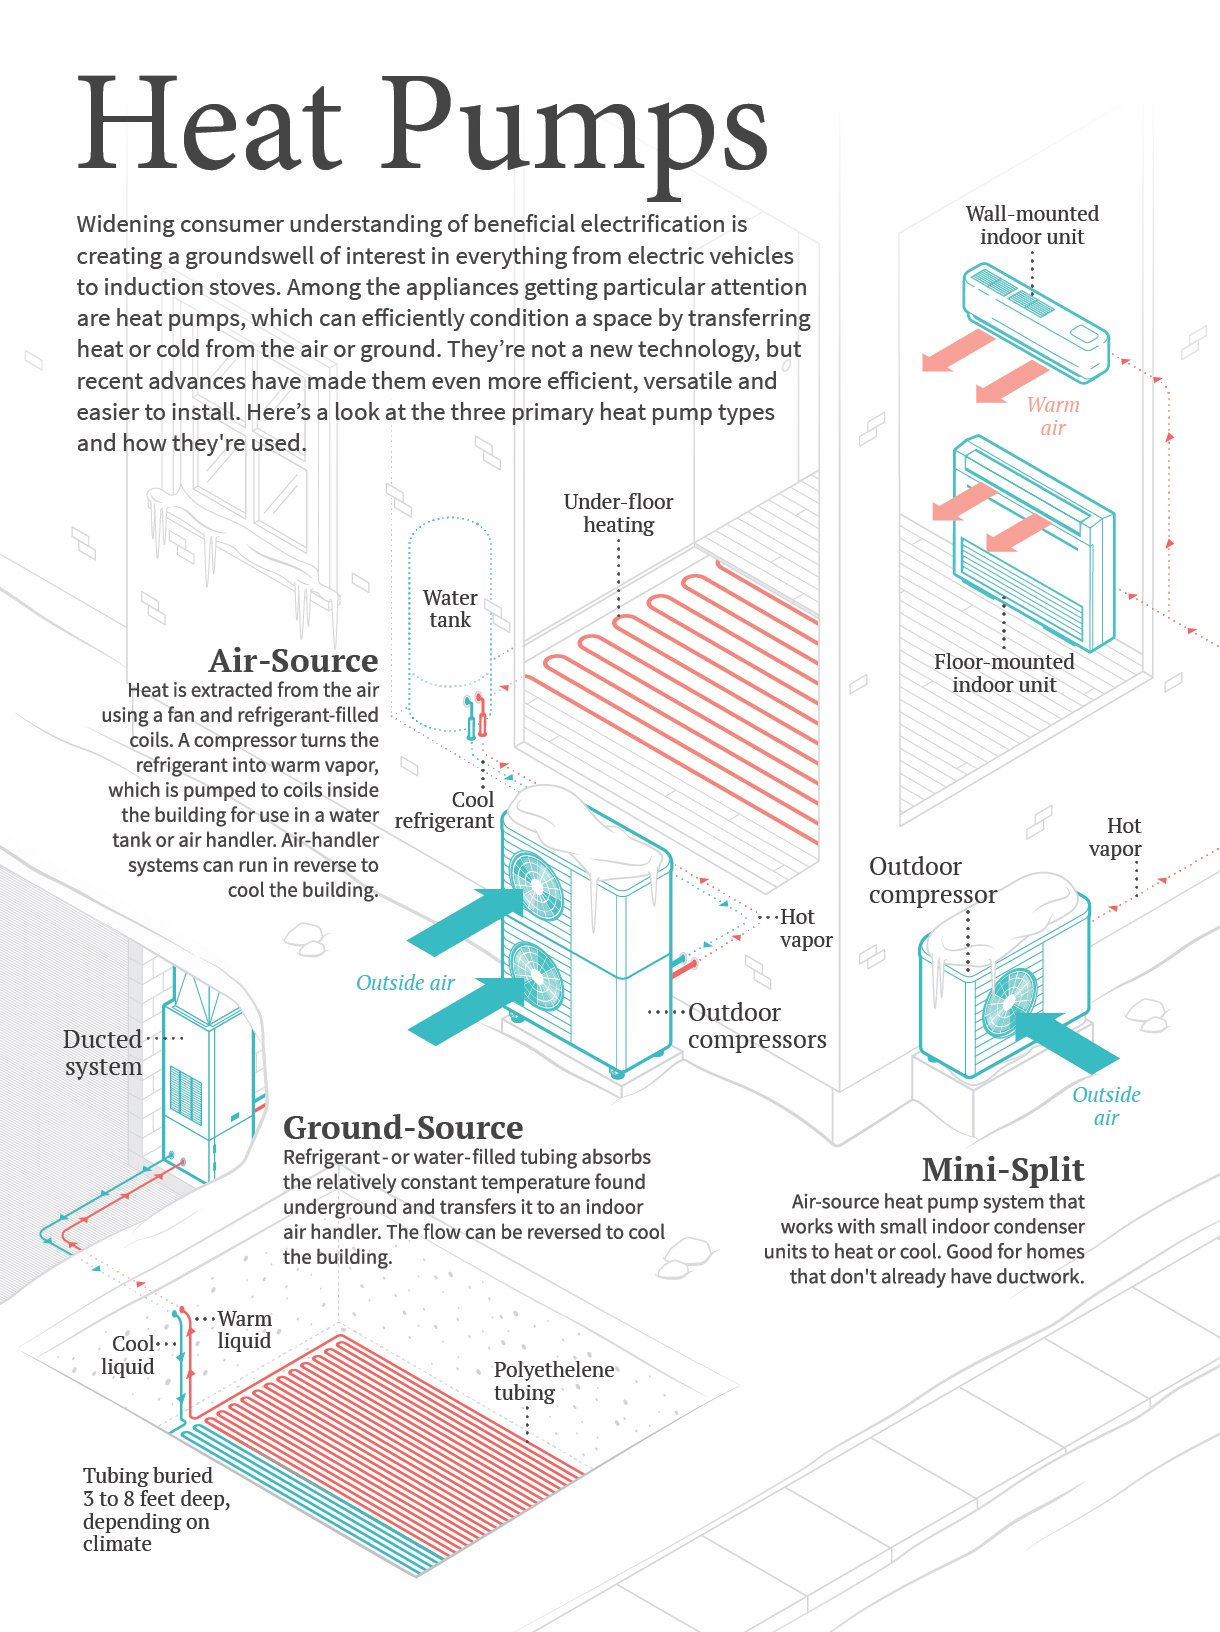
Infographic from May 2025 issue of RE Magazine
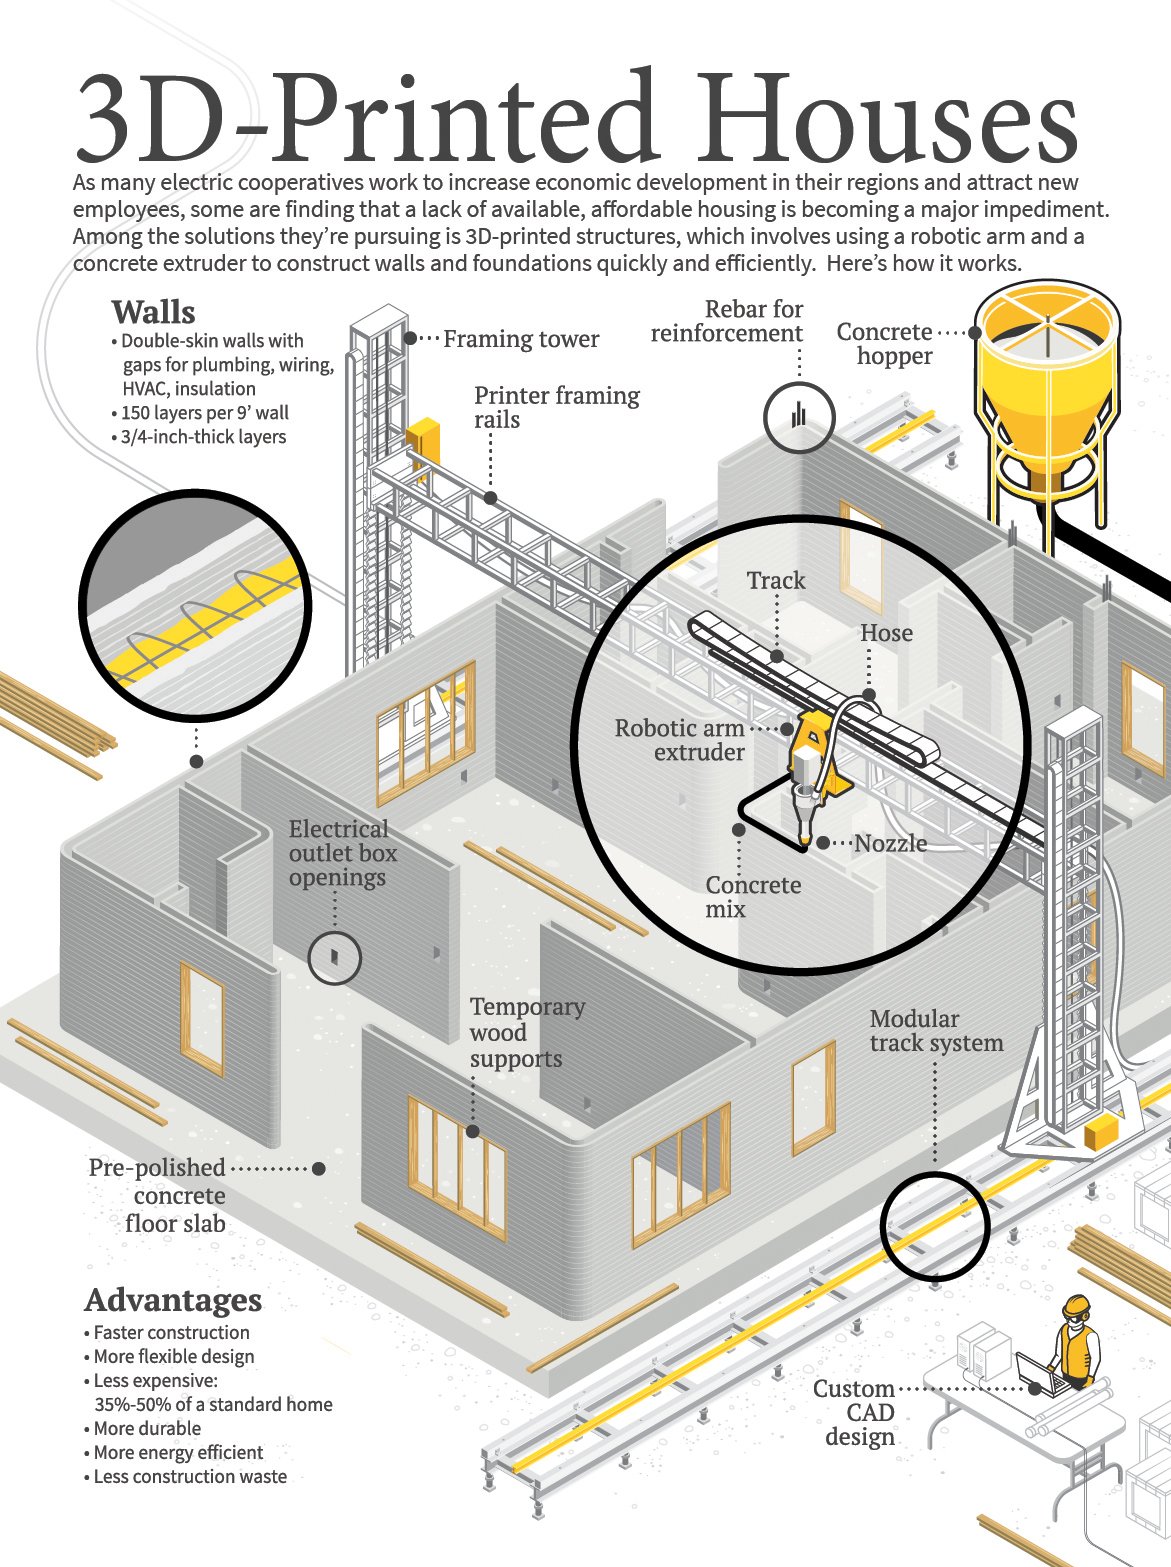
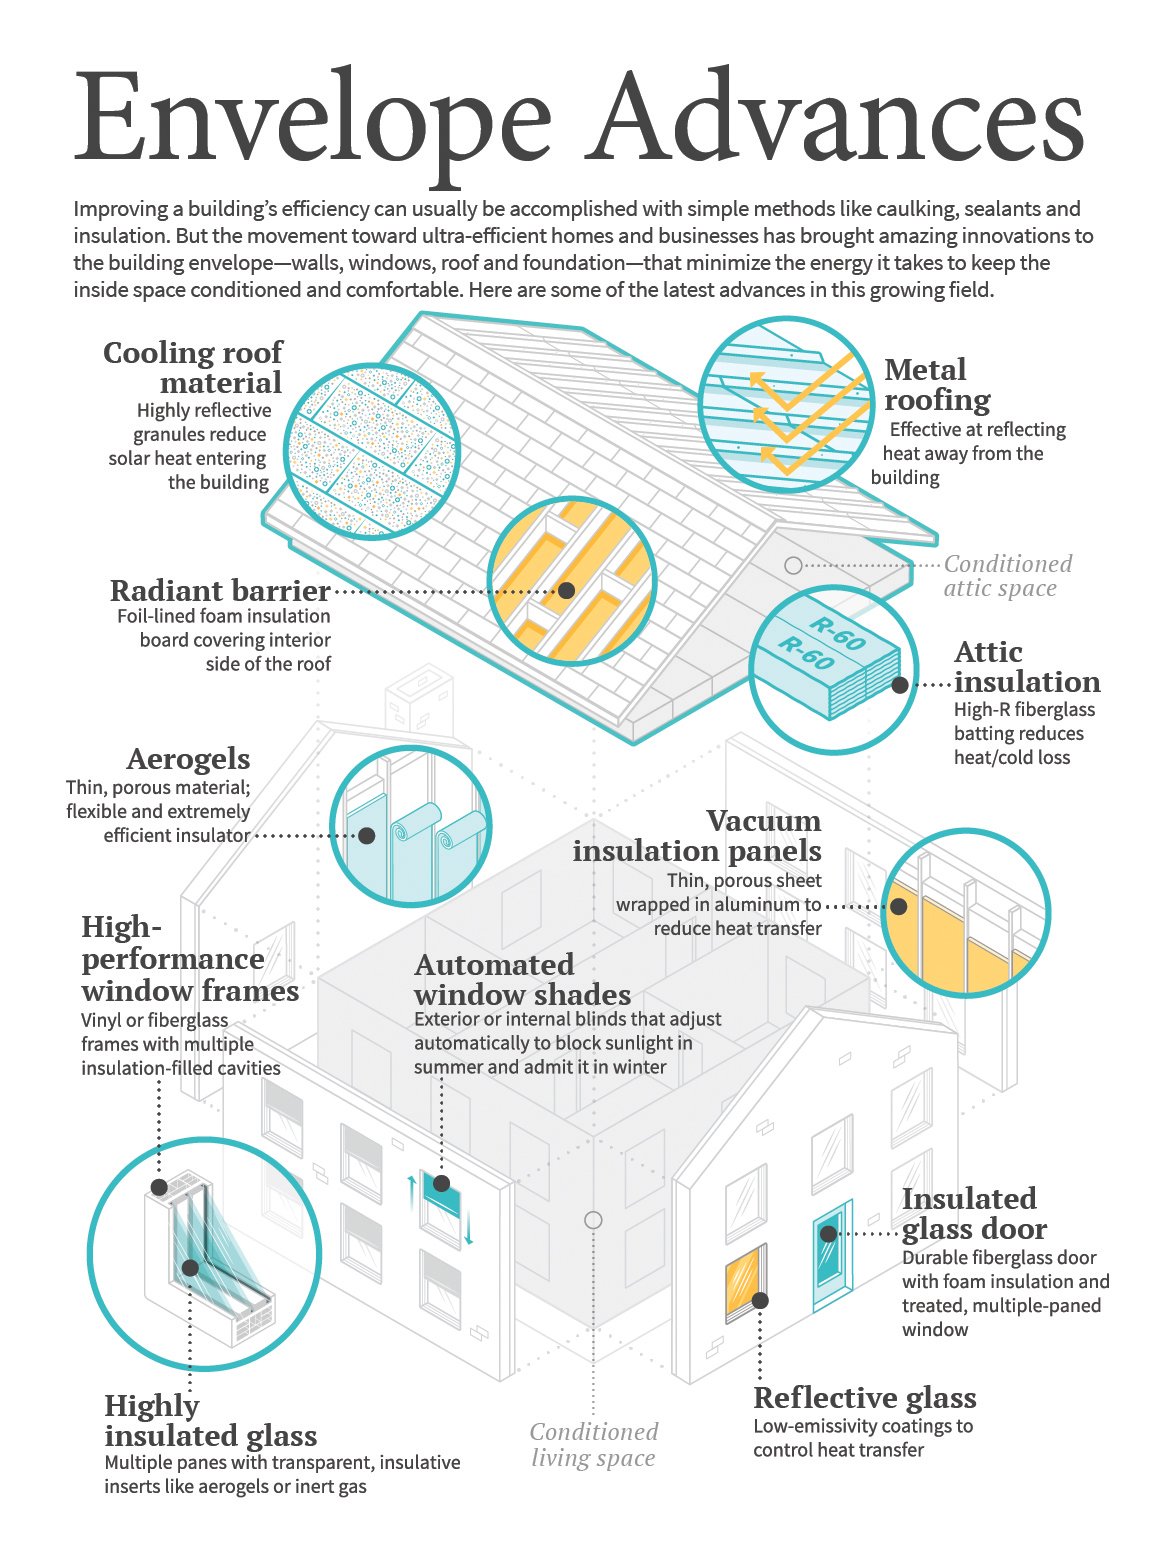
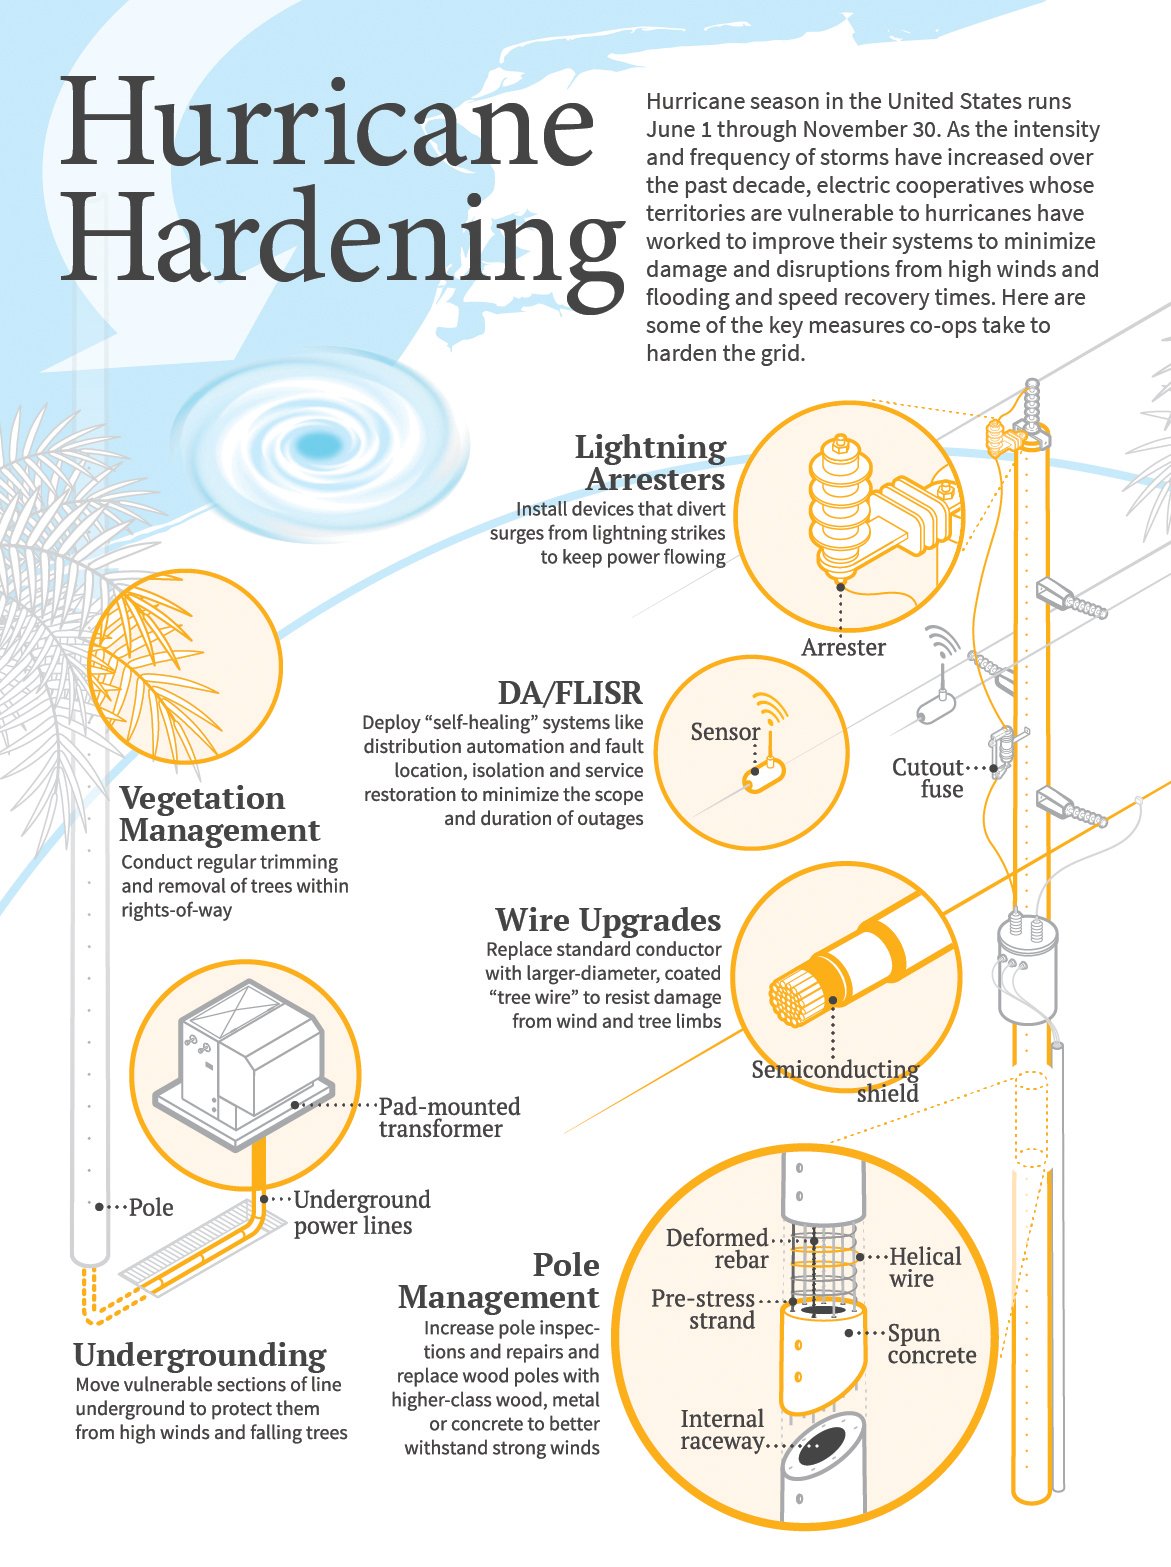
Infographic from April 2025 issue of RE Magazine
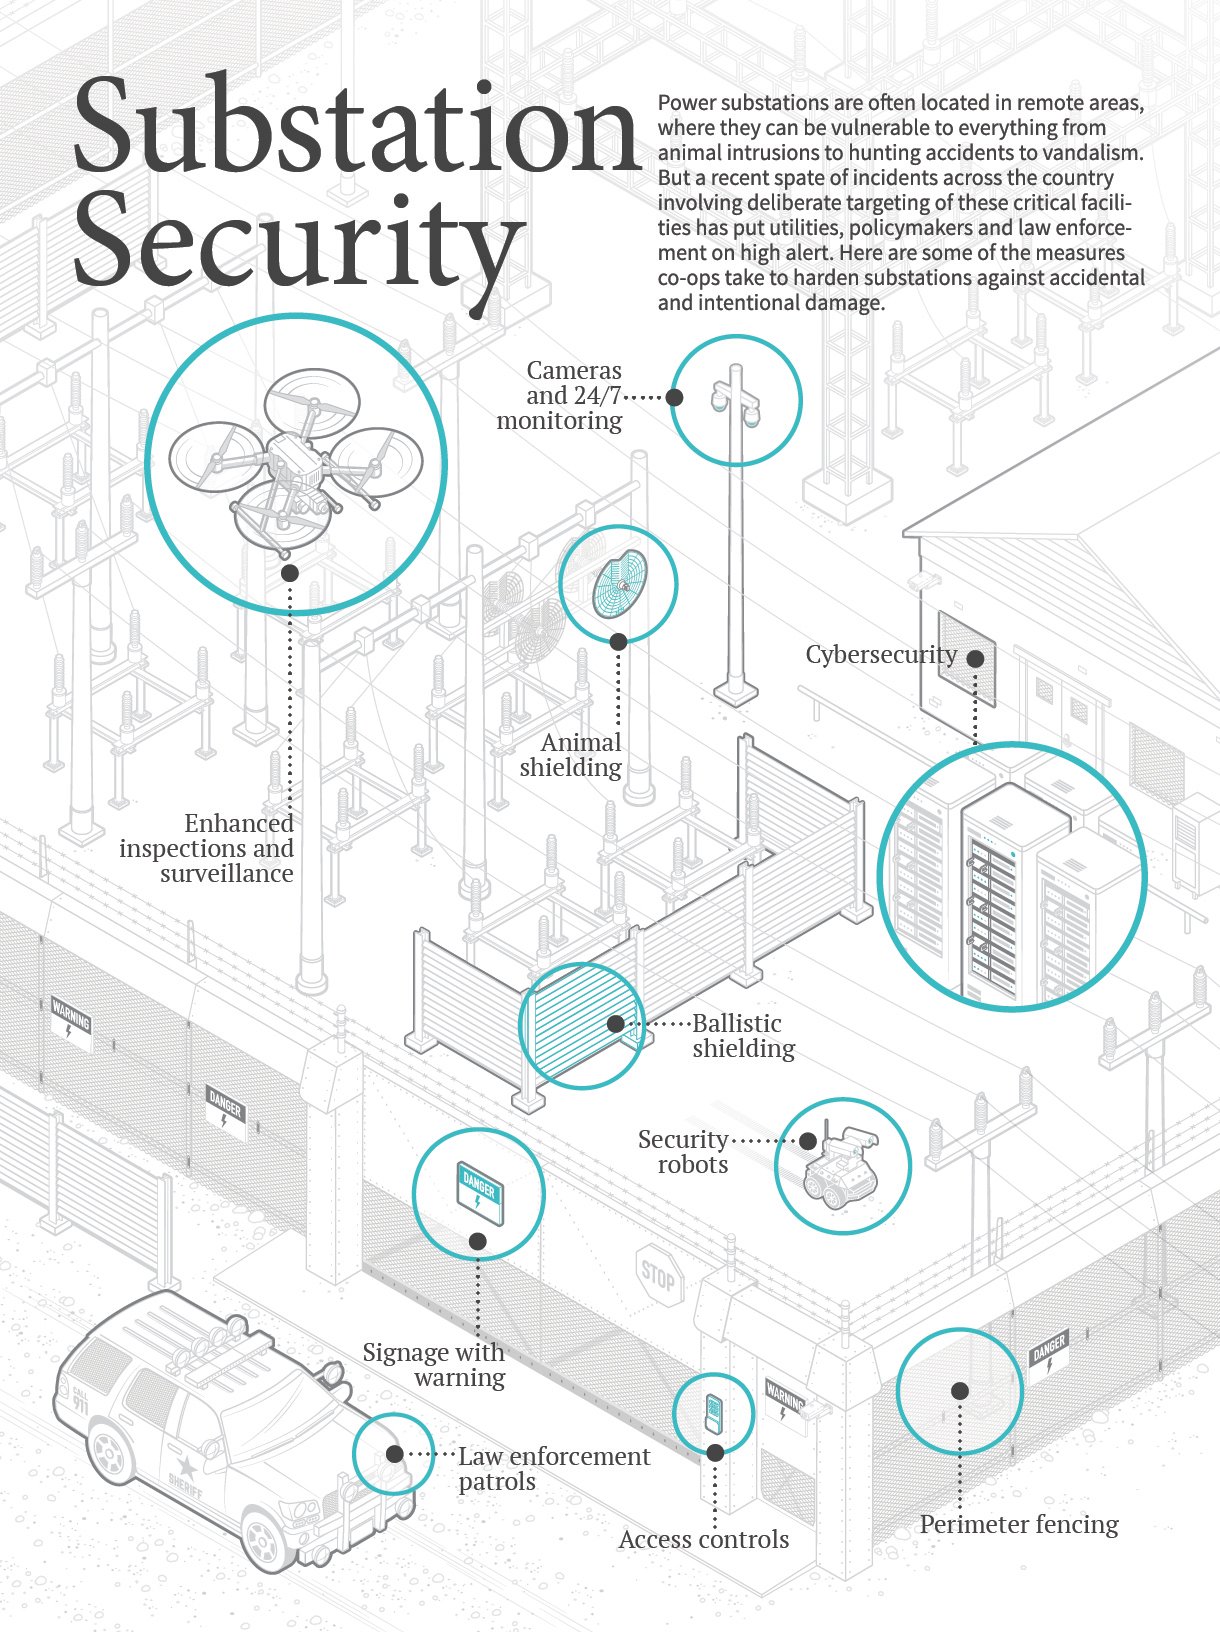
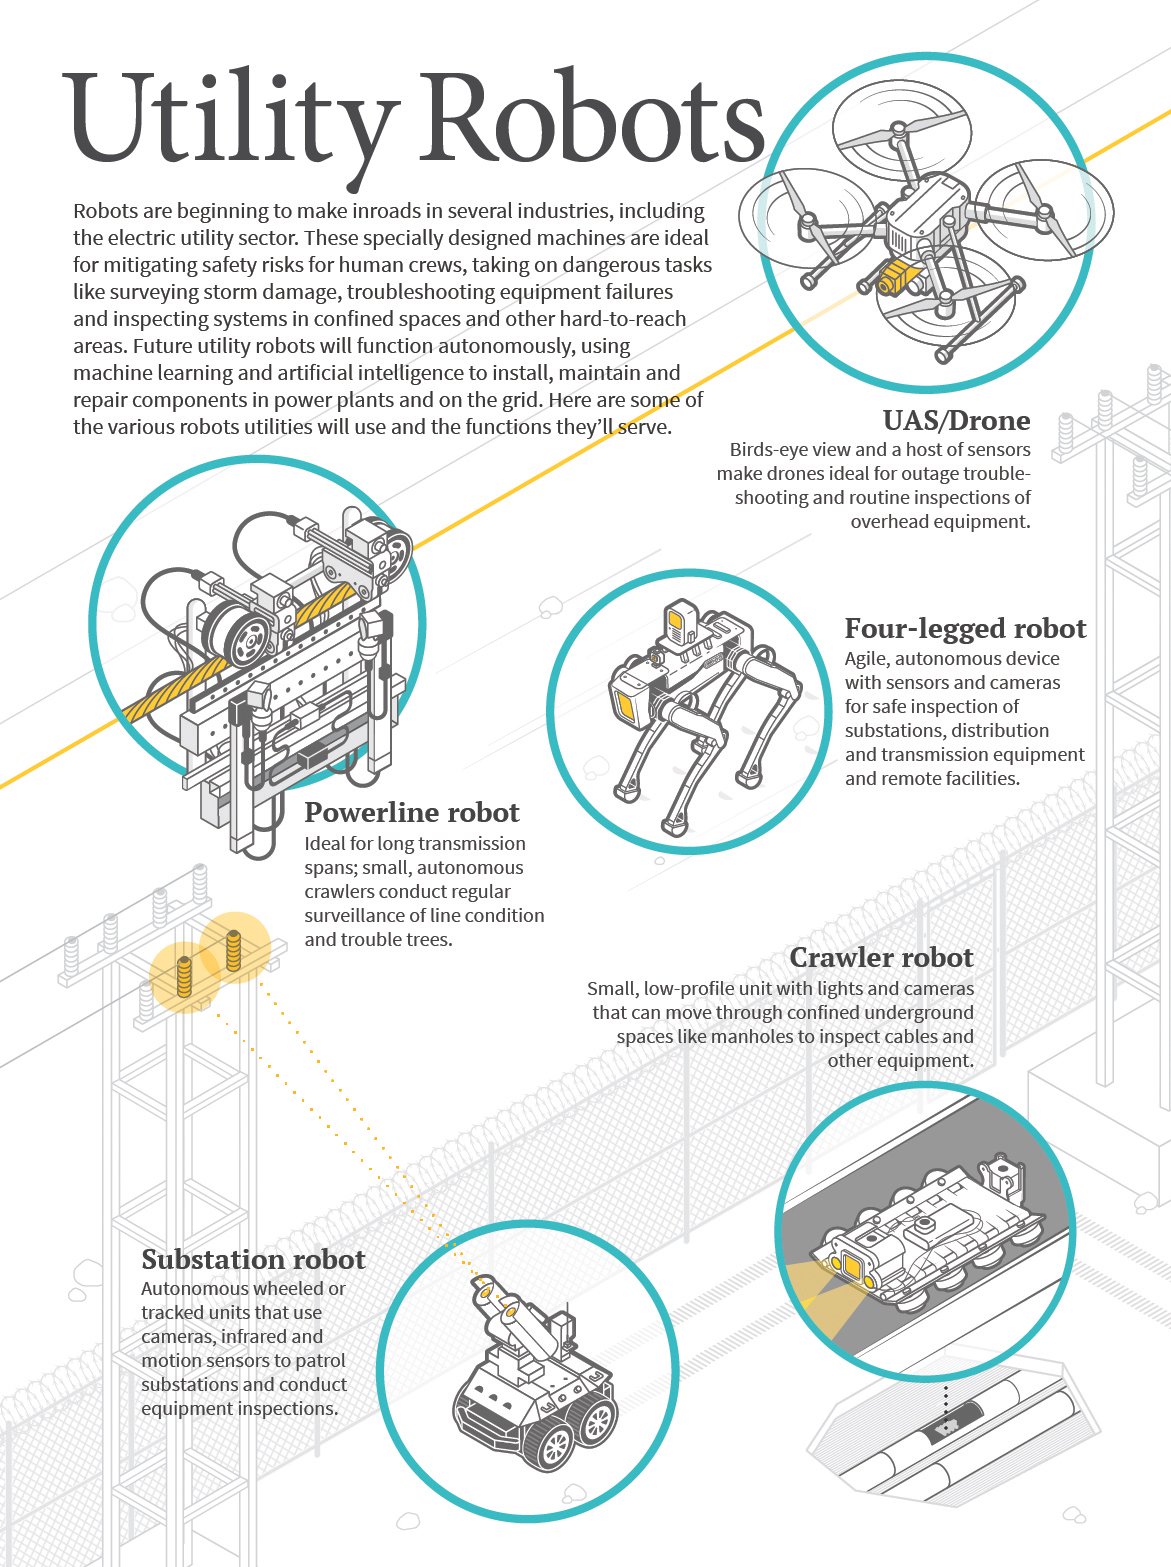
Infographic from March 2025 issue of RE Magazine

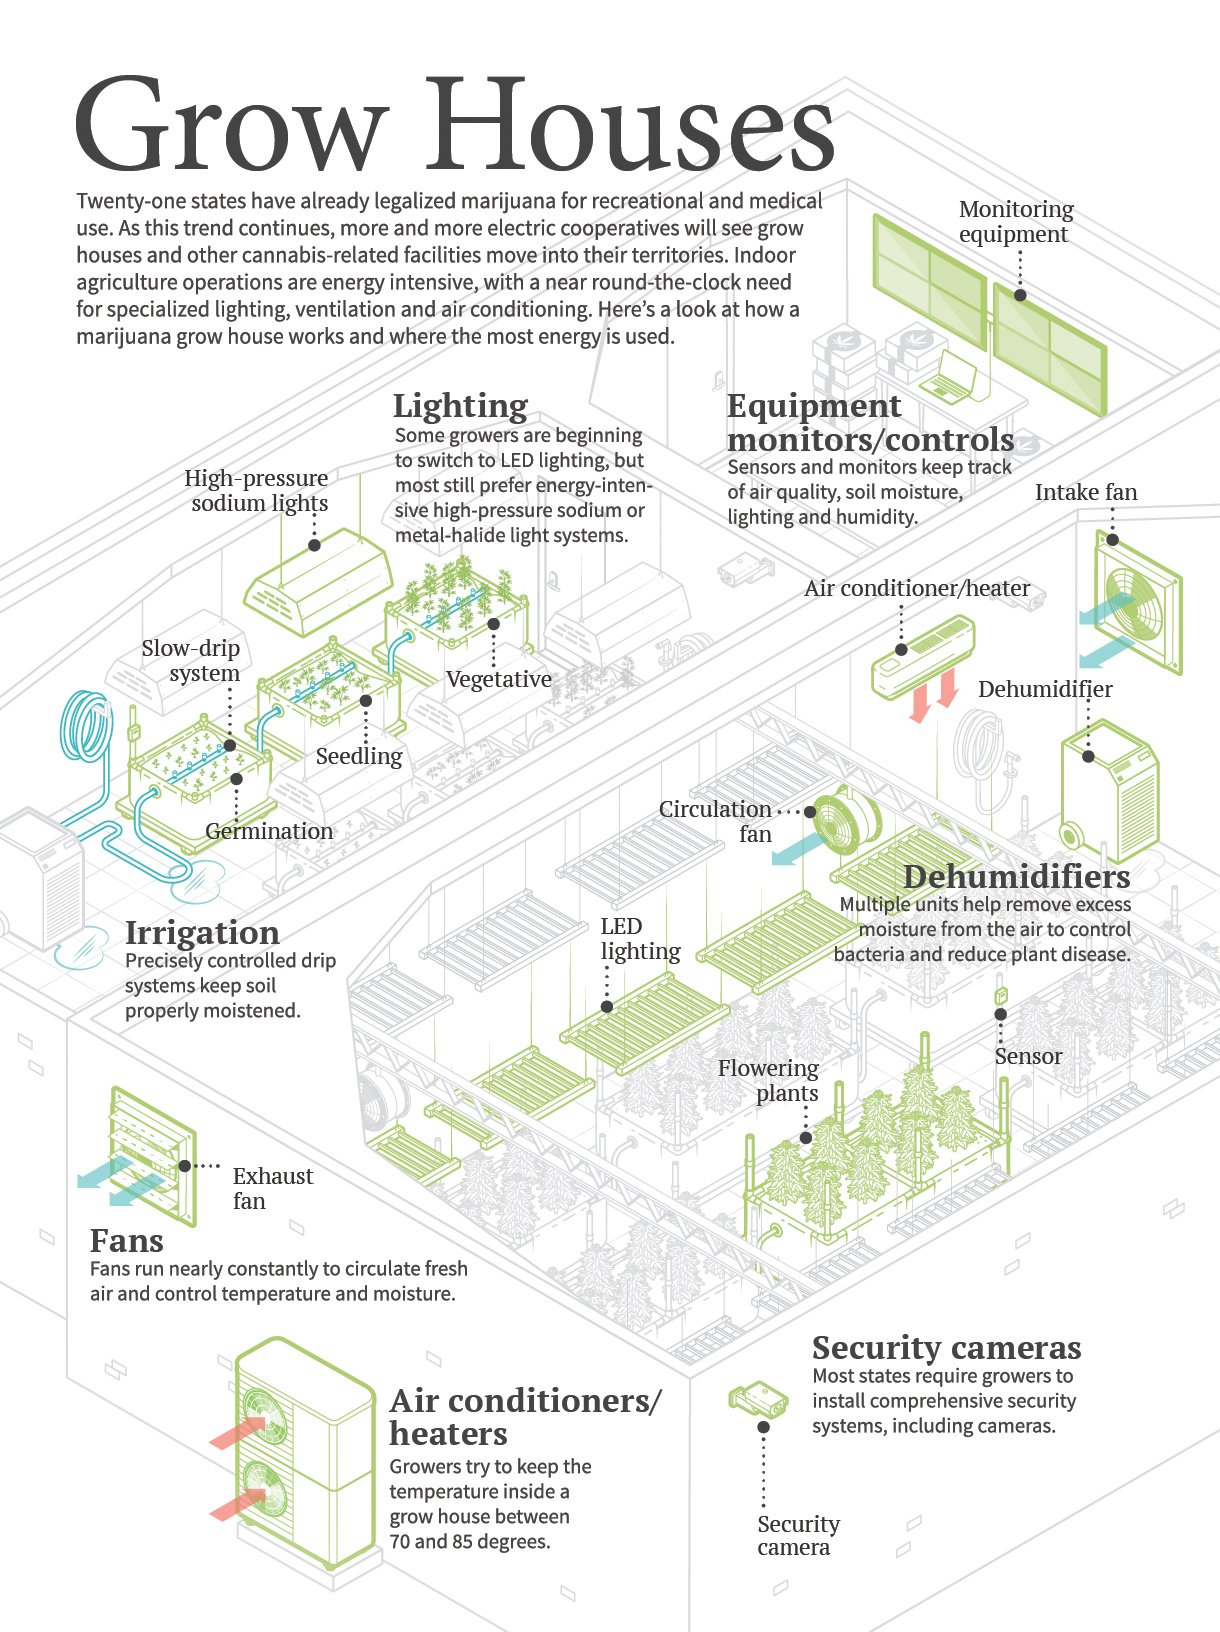
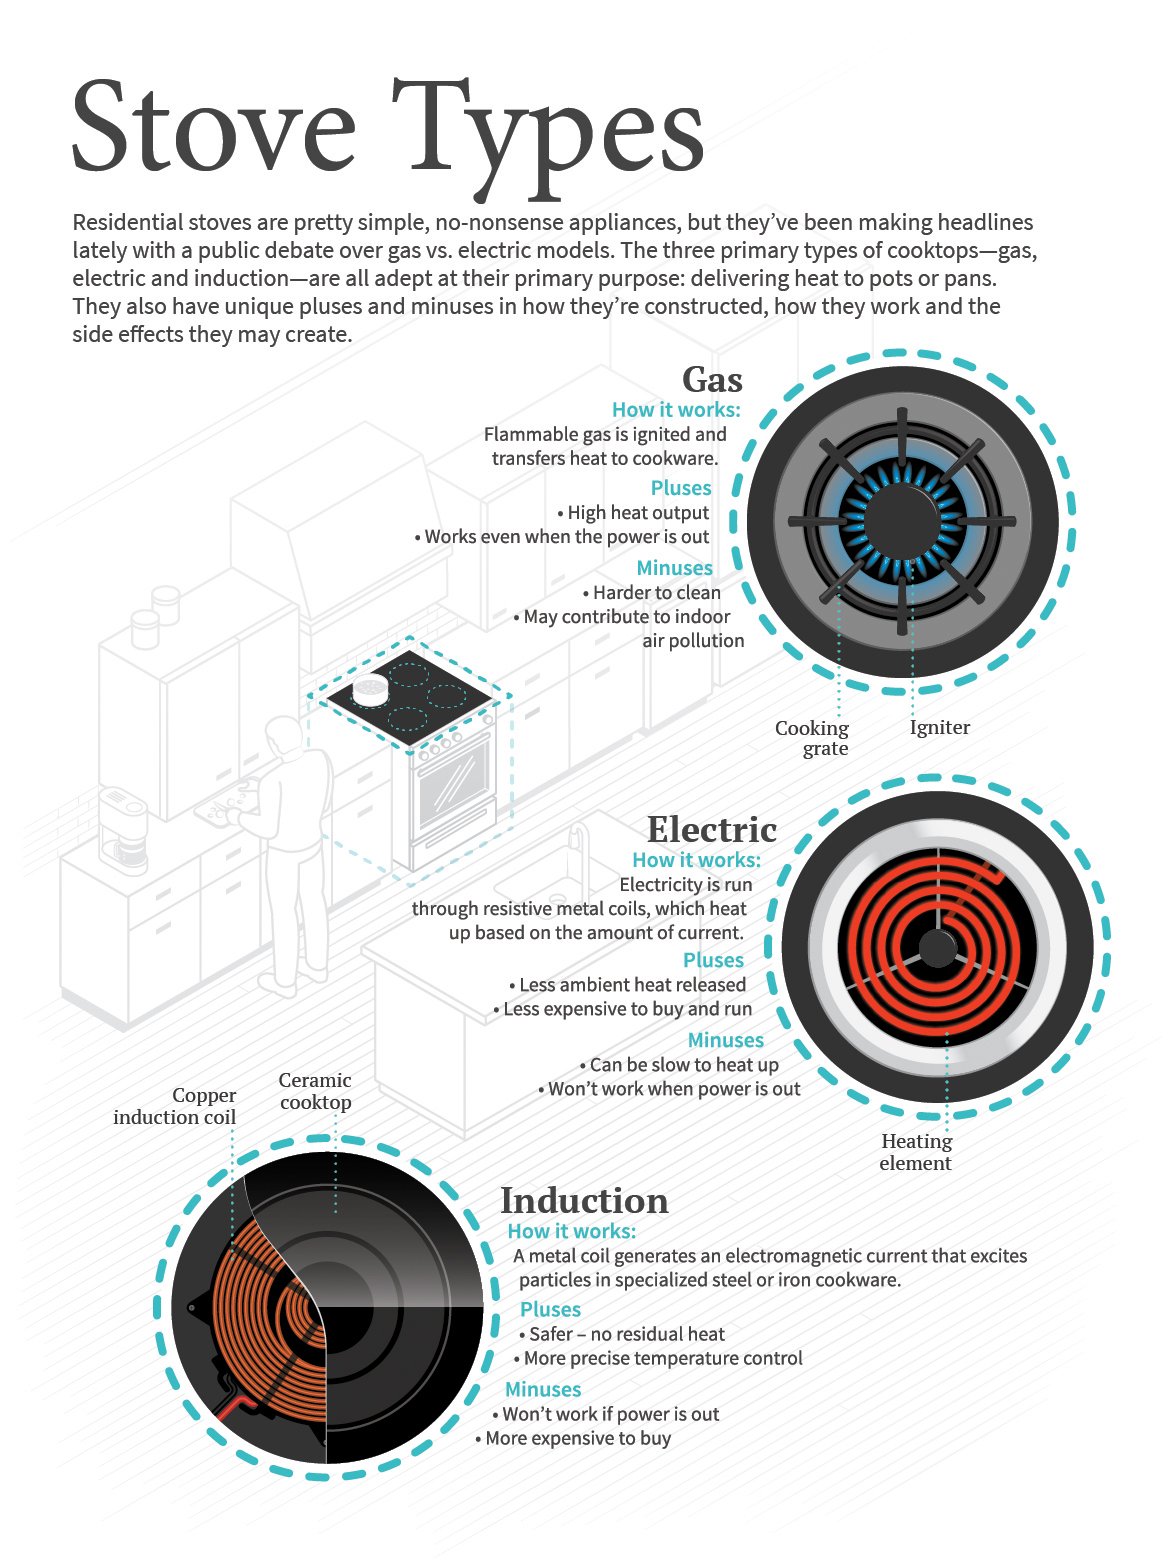
Infographic from February 2025 issue of RE Magazine
Infographic from December 2024 issue of RE Magazine
Infographic from October 2024 issue of RE Magazine

Infographic from August 2024 issue of RE Magazine
Infographic from August 2023 issue of RE Magazine
Infographic from June 2023 issue of RE Magazine
Infographic from April 2023 issue of RE Magazine
Infographic from March 2023 issue of RE Magazine
Infographic from January 2023 issue of RE Magazine
Infographic from December 2022 issue of RE Magazine
Infographic from July 2022 issue of RE Magazine
2022 Hermes Gold Award Winner
Infographic from February 2023 issue of RE Magazine
Infographic from November 2022 issue of RE Magazine
Infographic from September 2022 issue of RE Magazine
Infographic from May 2022 issue of RE Magazine

Infographic from March 2022 issue of RE Magazine
Infographic from November 2023 issue of RE Magazine
Infographic from August 2022 issue of RE Magazine
Infographic from June 2022 issue of RE Magazine

Infographic from April 2022 issue of RE Magazine
2023 Hermes Platinum Award Winner
Full page graphic published in RE Magazine, February 2022 issue
2022 Hermes Gold Award Winner
Infographic from December 2021 issue of RE Magazine

Infographic from July 2023 issue of RE Magazine
Infographic from November 2021 issue of RE Magazine

Full page graphic published in RE Magazine, September 2021 issue

Full page graphic published in RE Magazine, August 2021 issue
Full page graphic published in RE Magazine, June 2021 issue
2022 Hermes Platinum Award Winner

Full page graphic published in RE Magazine, April 2021 issue

Full page graphic published in RE Magazine, April 2021 issue
Infographic fromOctober 2023 issue of RE Magazine. (with Jeff Dionise)

Illustration of how Solar Panels turn Sunlight into electricity and use it to feed the grid.
Created with Adobe Illustrator
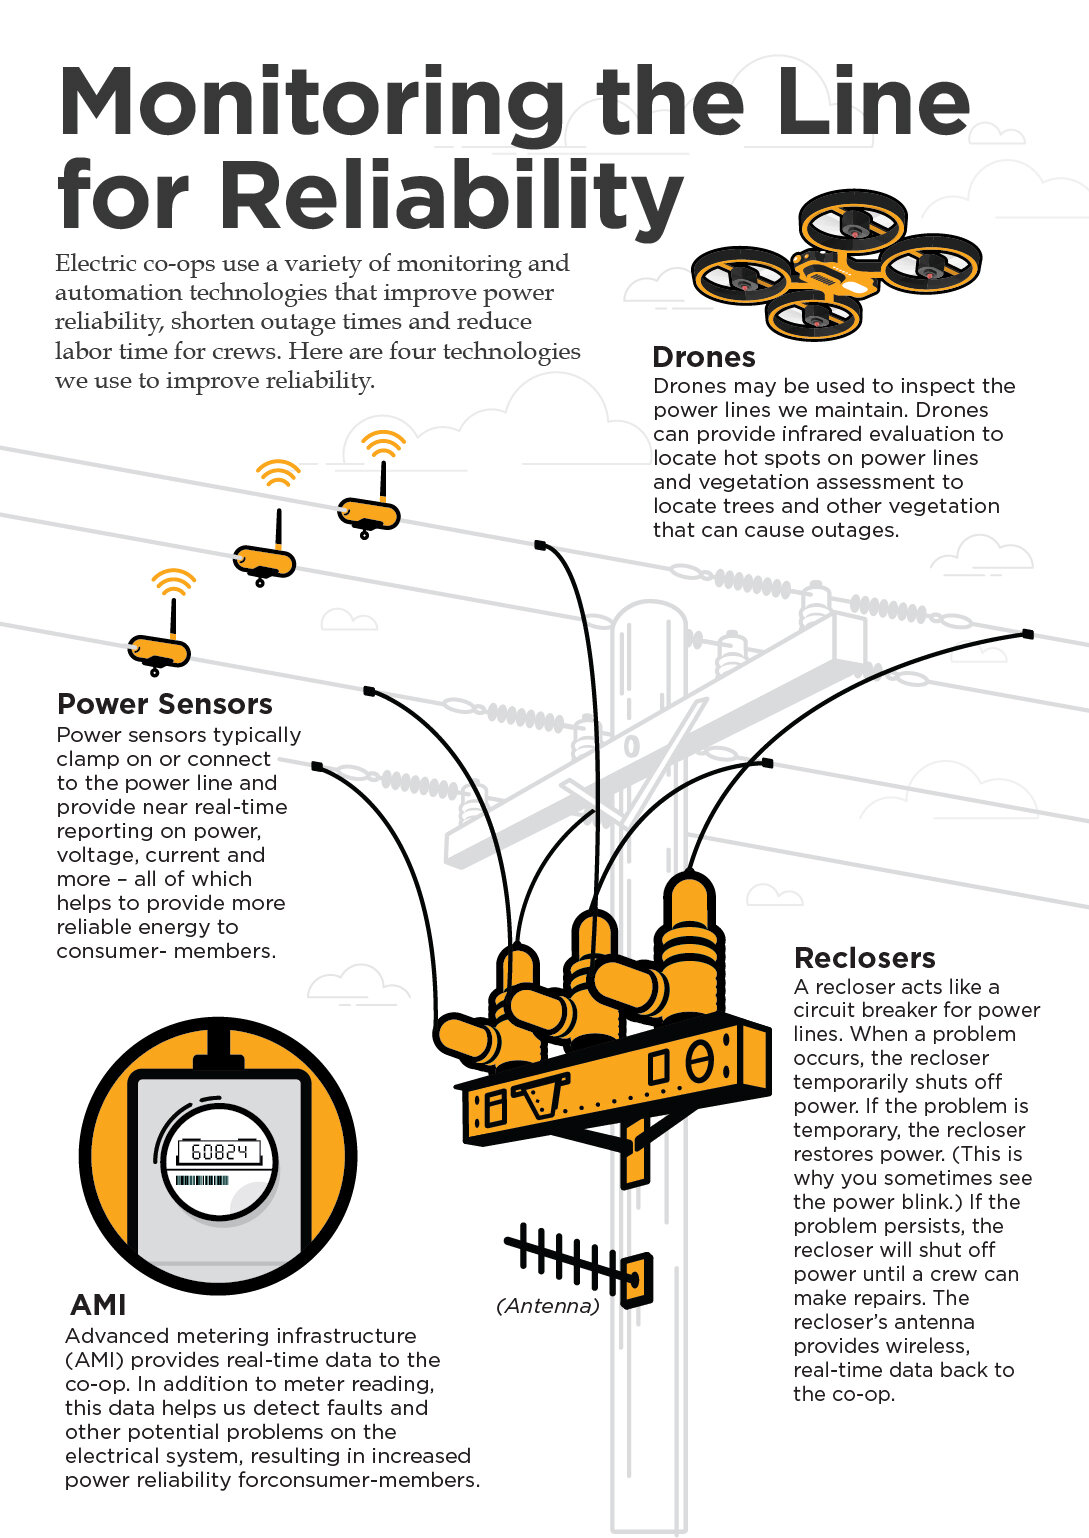
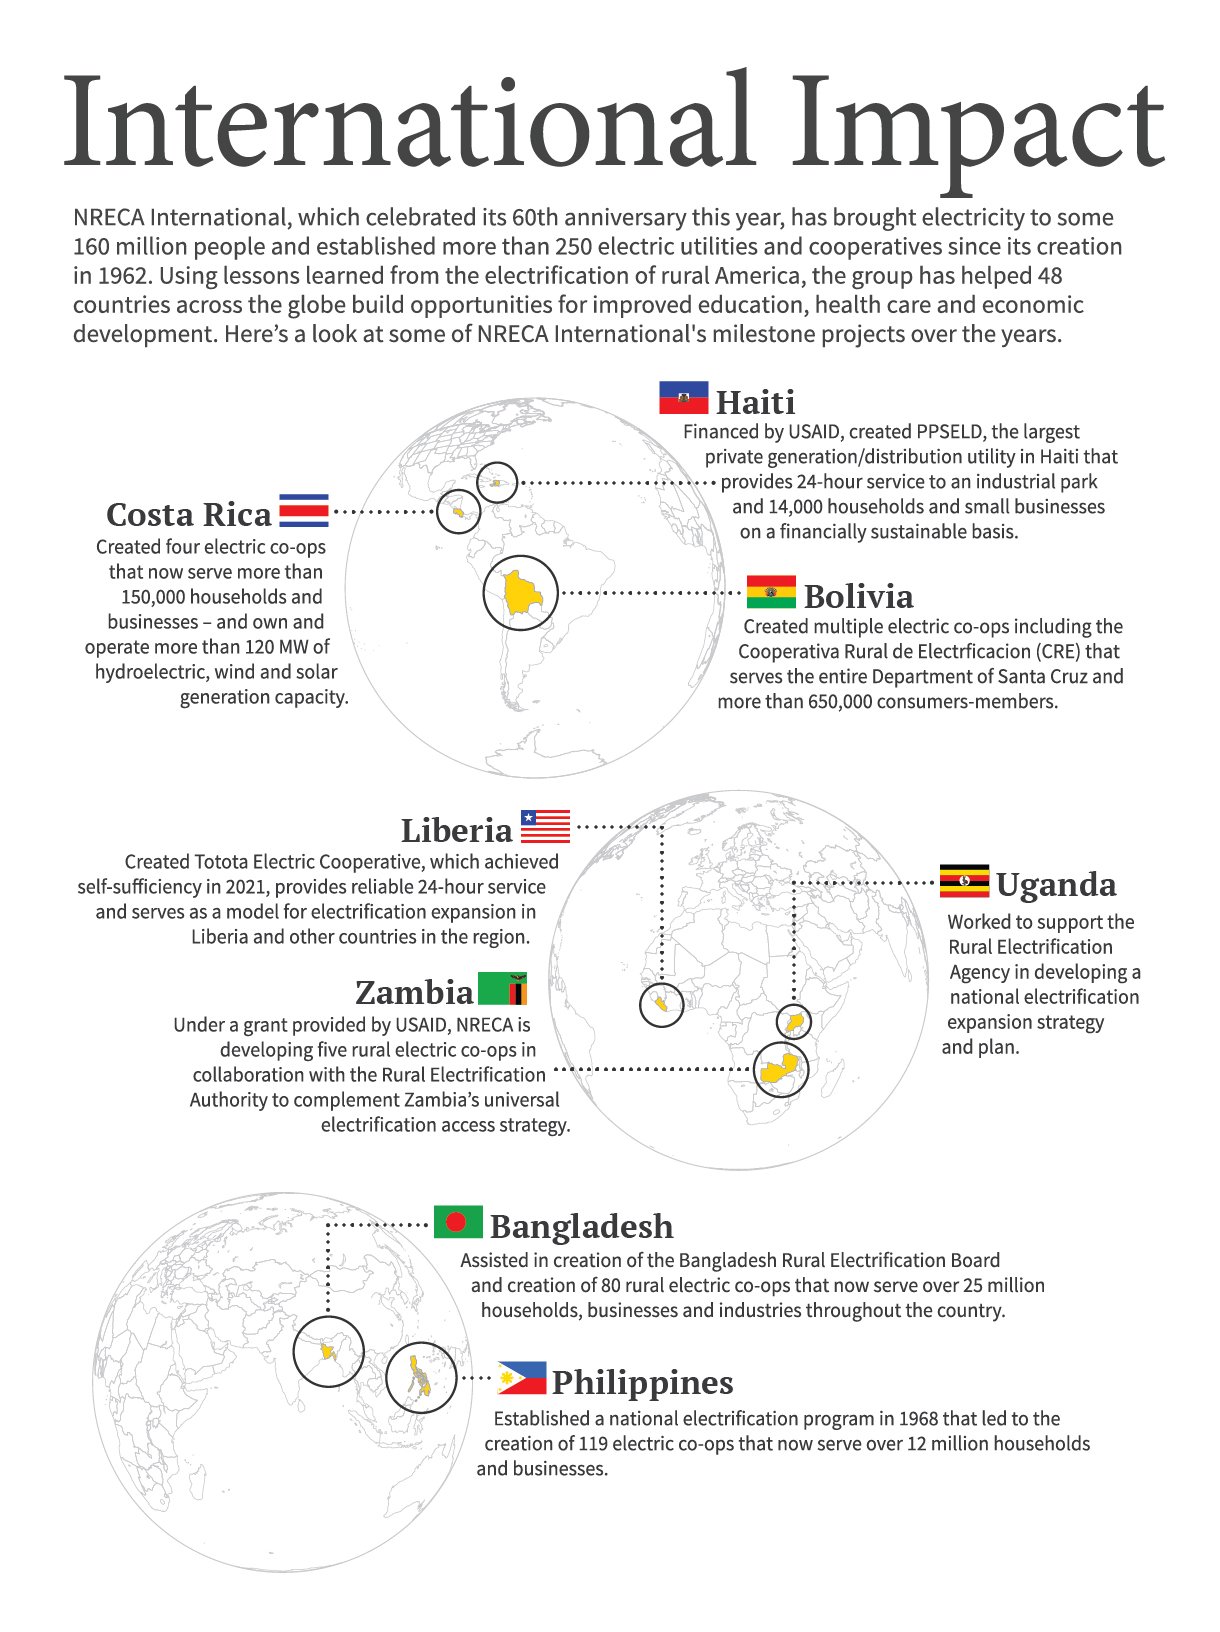
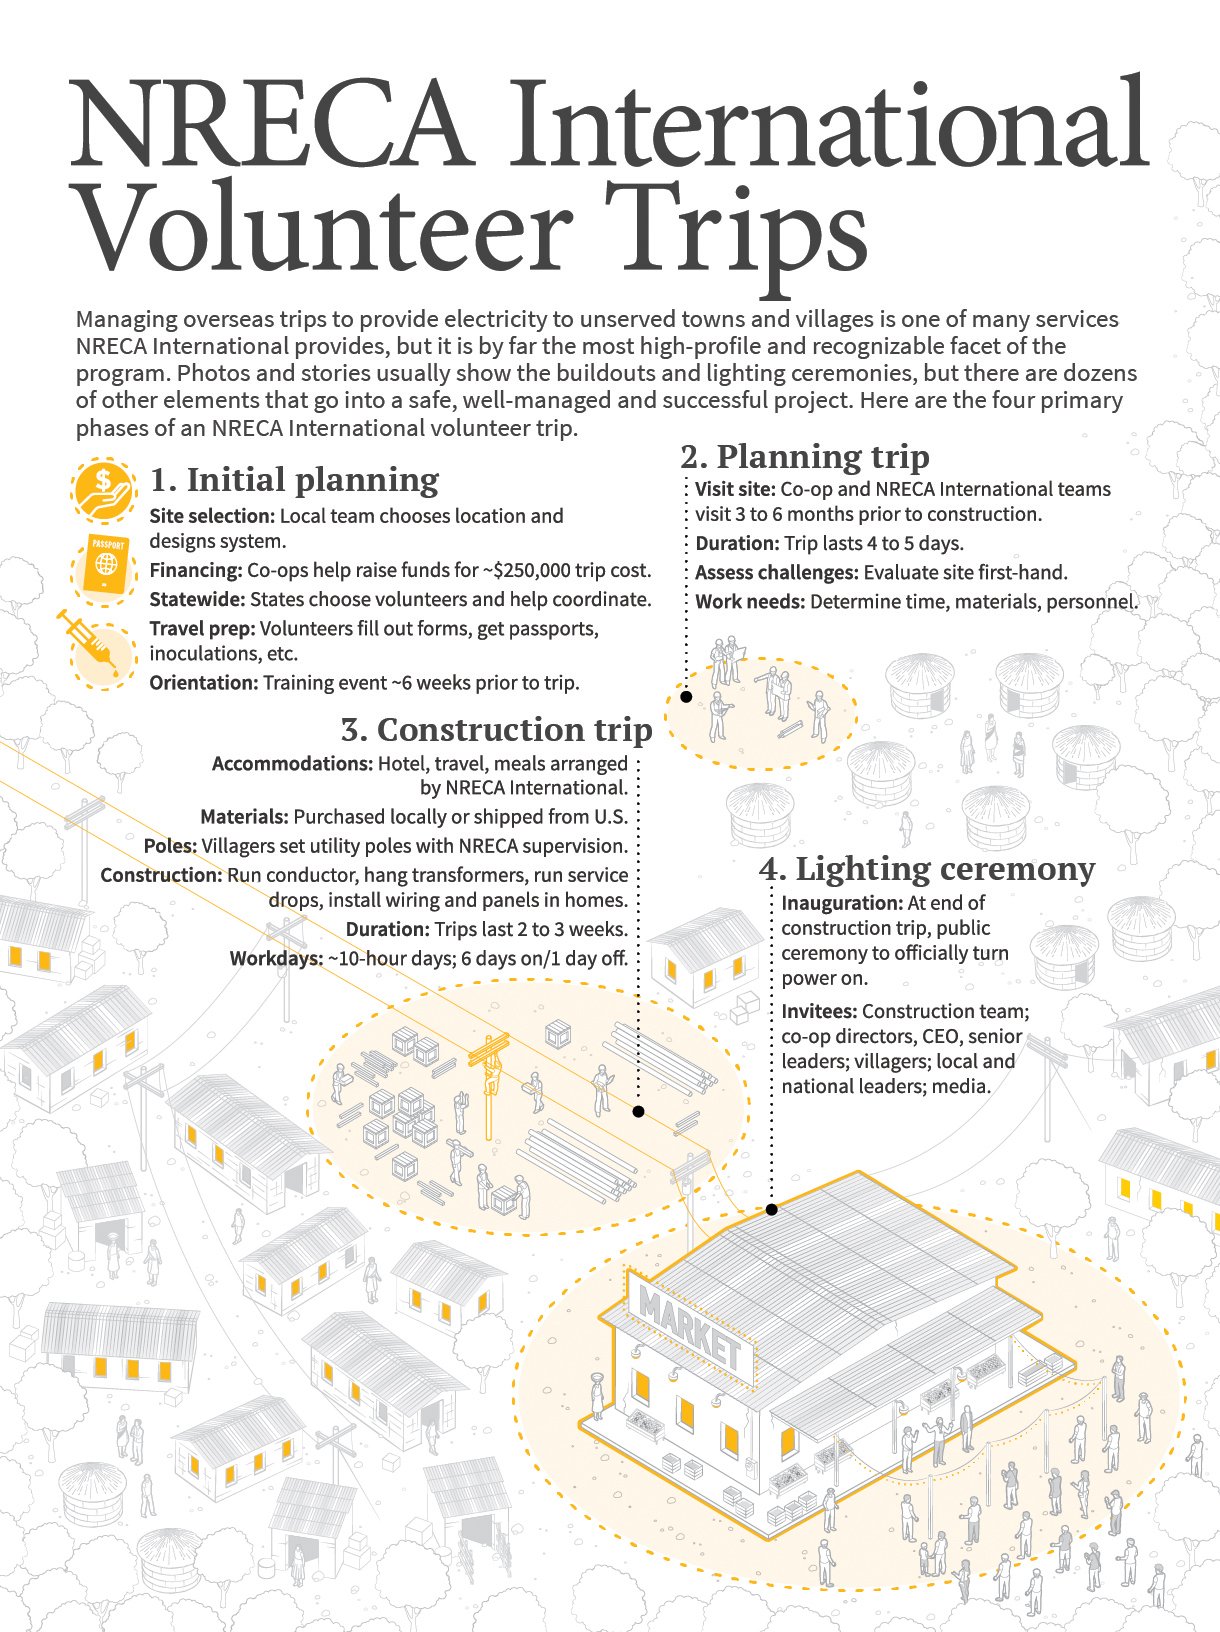
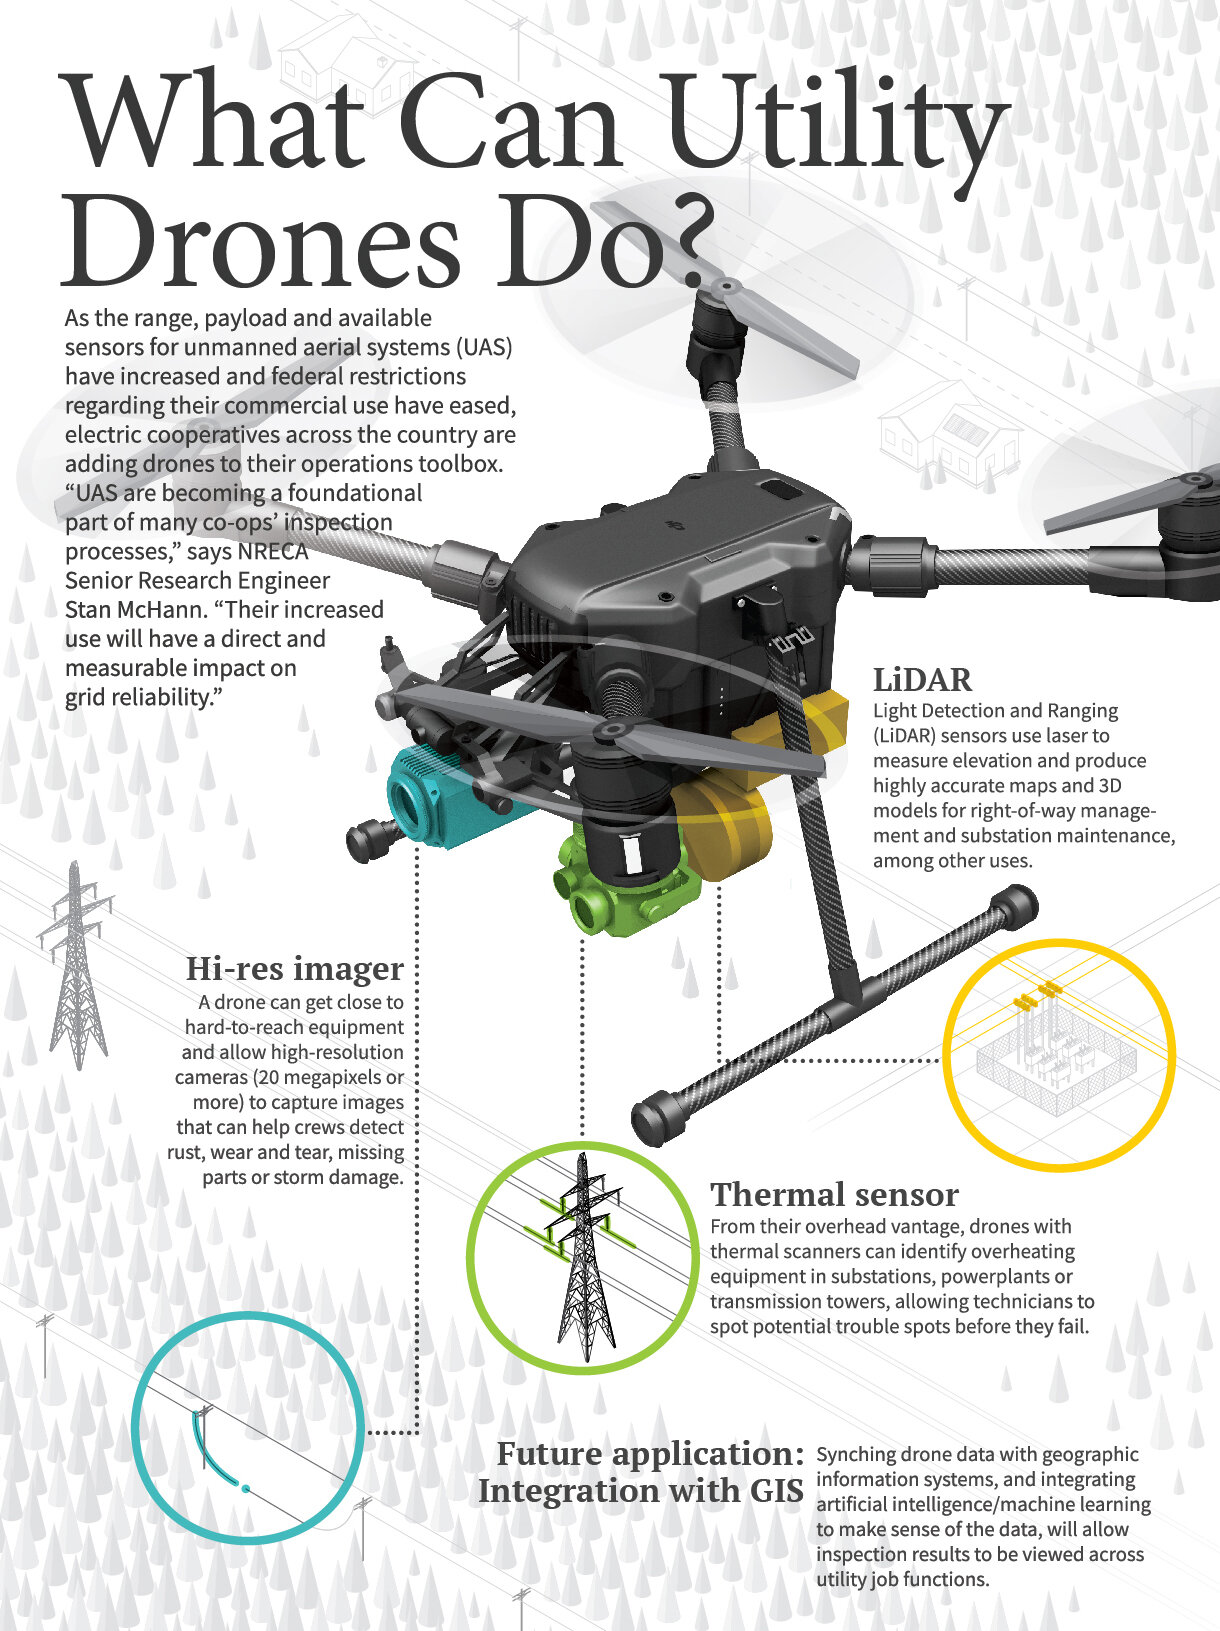
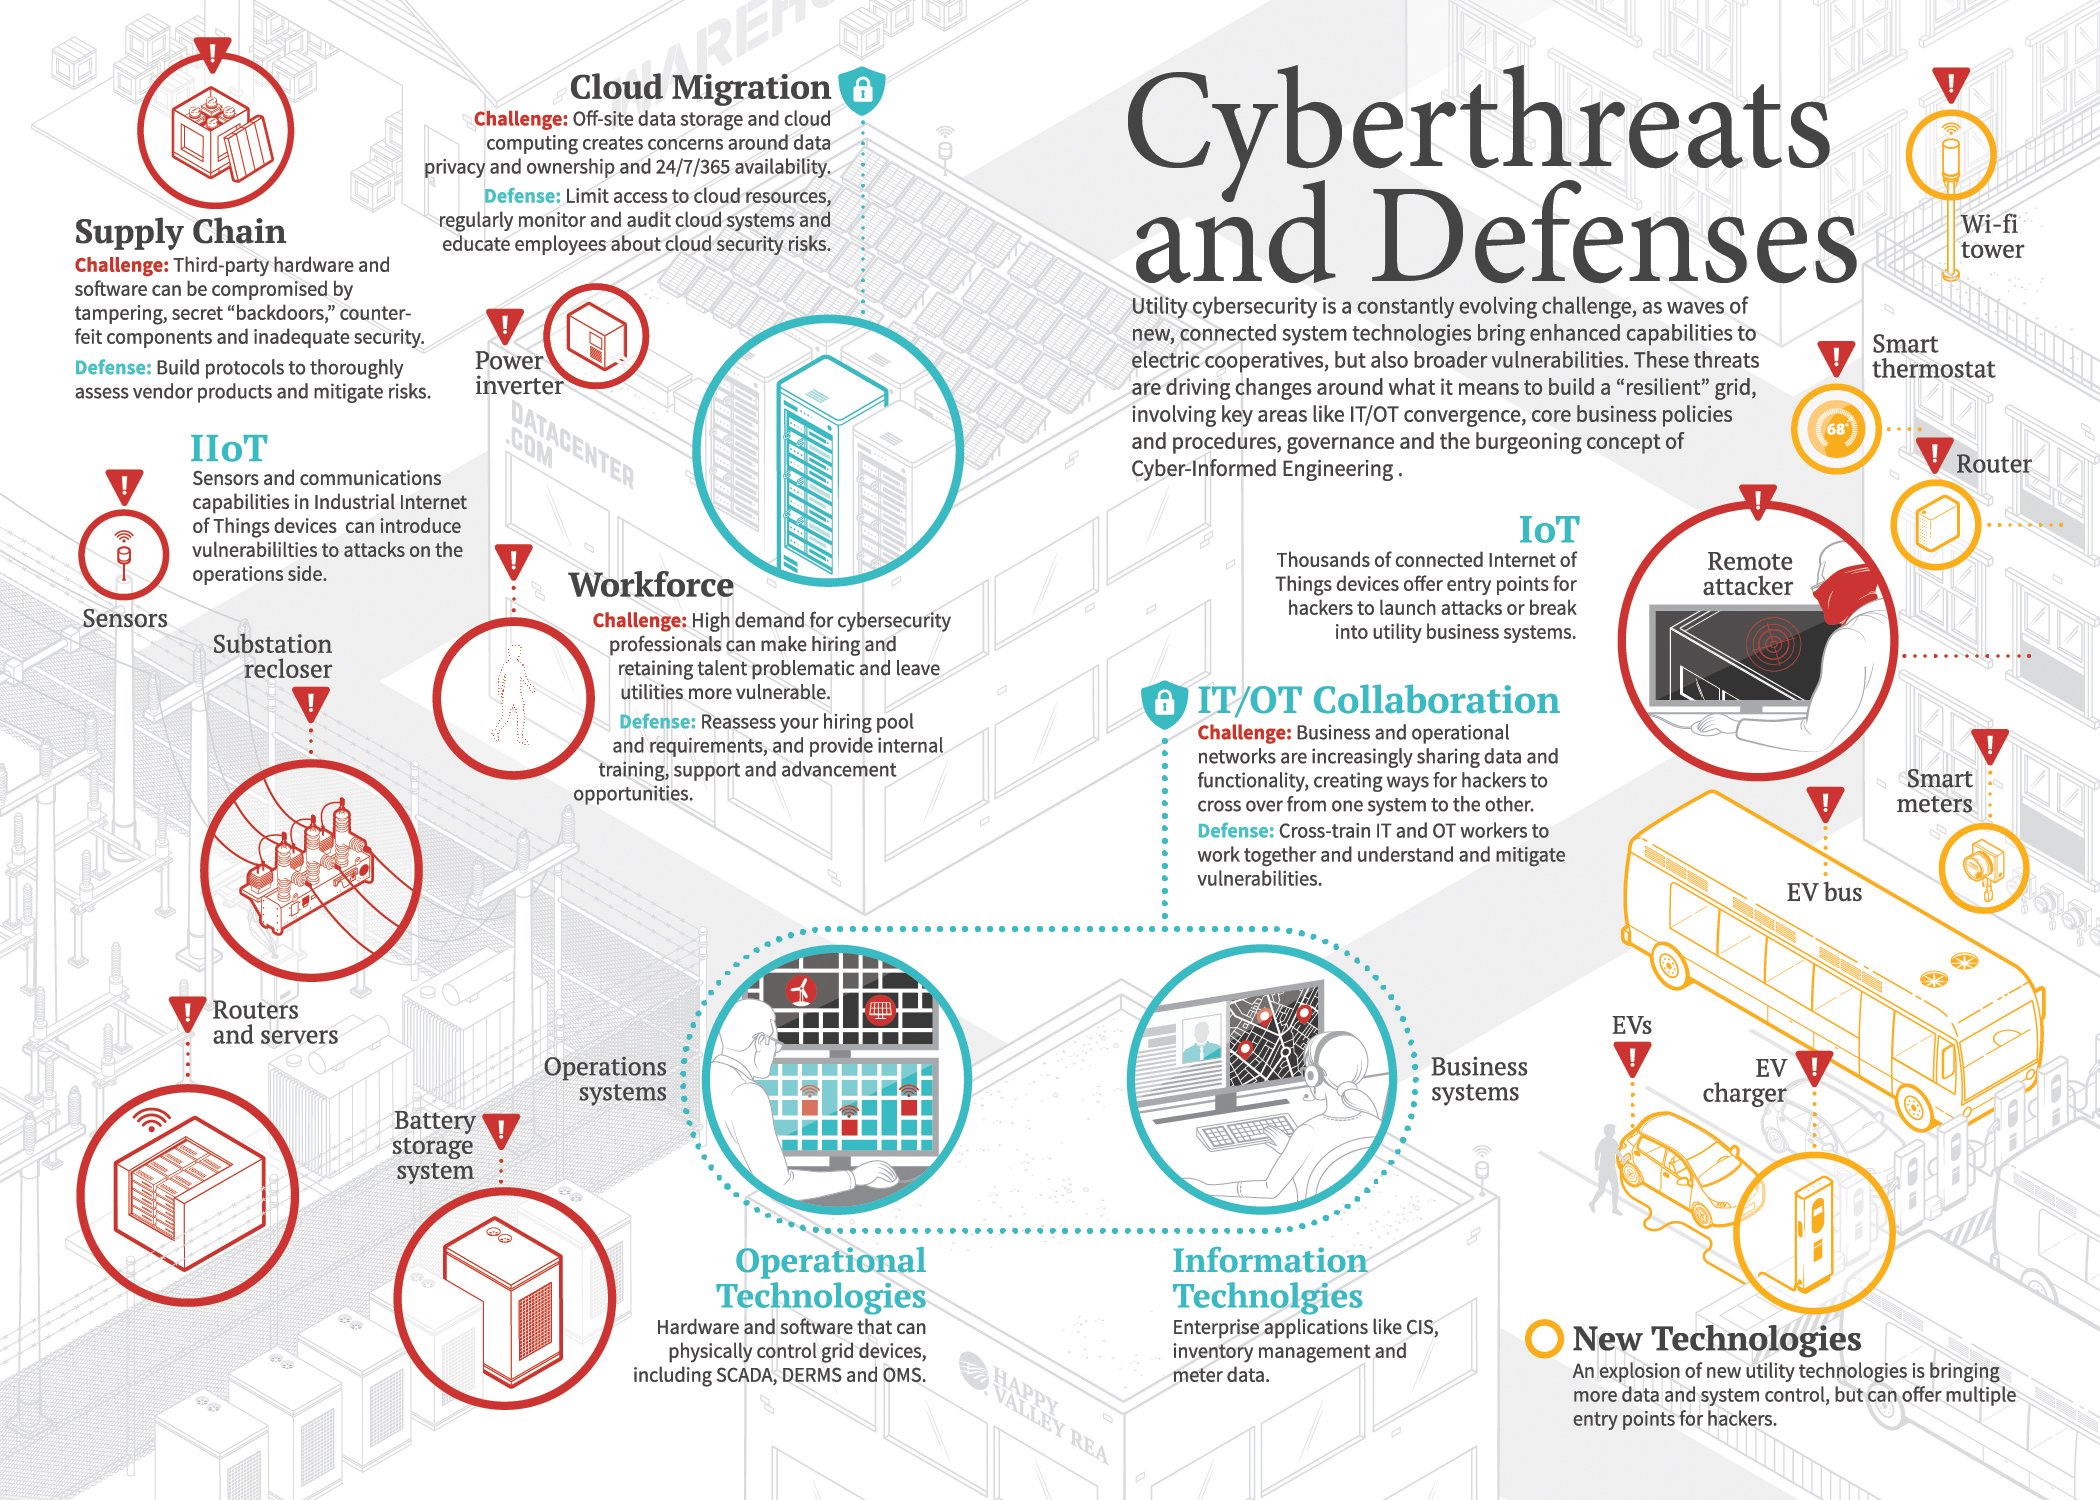
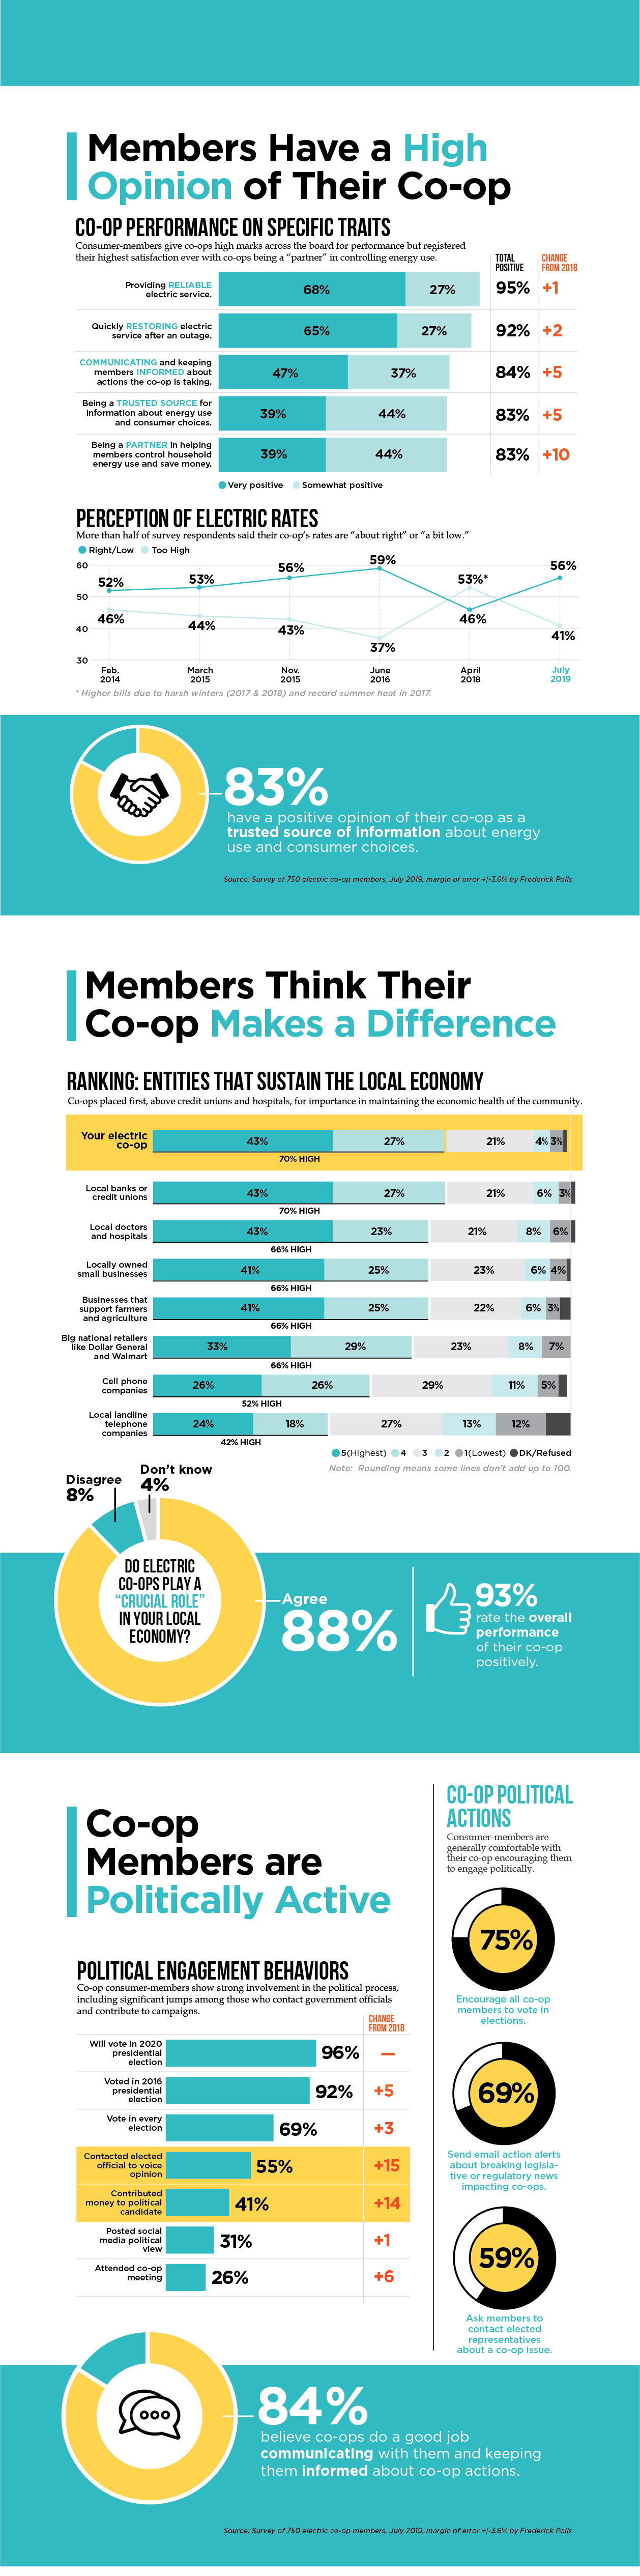
Infographic for NRECA

Using a mixture of charts, facts and illustrations, this full page infographic ran on the eve of the Scottish independence vote and gives a rundown of what was at stake.
LINK: https://goo.gl/hhVy3L
Created with Adobe Illustrator and Adobe Photoshop
Stylized chart package
Created with Adobe Illustrator

Long form infographic created for The Wilderness Society urging the Obama Administration to take a more balanced approach to land management and comparing that approach to previous administrations.
LINK: https://goo.gl/sEMYwt
Created with Adobe Illustator

This long form infographic serves as an in-depth look at world population as it stands today, where people live, and features a timeline showing significant population milestones along with other associated facts.
LINK: https://goo.gl/Uh3W47
Created in Adobe Illustrator

Isometric cutaway graphic showing the interior of a mobile home and ways for homeowners to save money on heating and cooling.
Created with Adobe Illustrator

Isometric landscape/weather graphic explaining how Microgrids work and their vulnerability during storms.
Created with Adobe Illustrator

For this graphic I wanted to show how isolated microgrids work inside of cities. I purposely pulled the non-involved buildings back in tone and brought the relelvant information to the fore with color.
Created with Adobe Illustrator

One-page illustration to explain the concept of Carbon Capture.
Created with Adobe Illustrator

This was a really fun graphic to write and draw. feel free to pass it around this holiday season!
Created with Adobe Illustrator

This graphic is directed at the Agriculture worker. The goal is to educate the reader on basic safety tips when confronted with downed electrical wires in rural areas.
Created with Adobe Illustrator
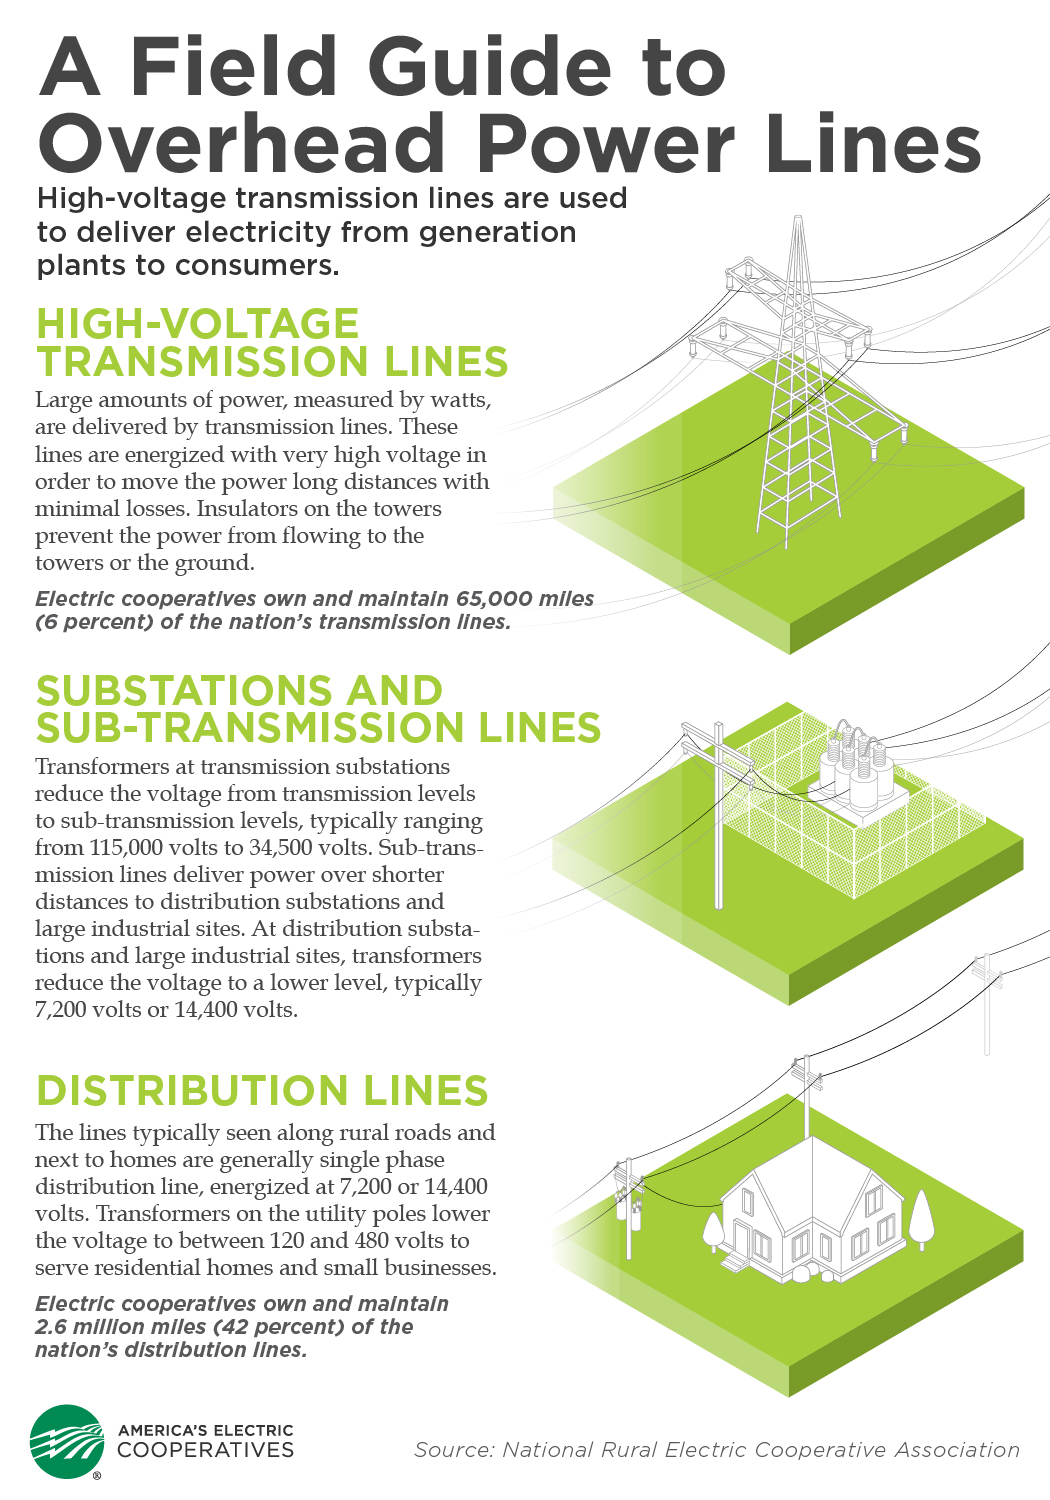
The goal of this graphic is to educate the reader on the three types of electrical wires and how to tell them apart.
Created with Adobe Illustrator

USA! USA! USA!
From frankfurters to fireworks, this is a quick look at how Americans celebrate the Fourth of July.
Created with Adobe Illustrator

This graphic is directed at the general public. The goal is to educate the reader on basic safety tips when confronted with downed electrical wires.
Created with Adobe Illustrator

Capitol Dome Restoration. I worked directly with a writer, a researcher and the architects responsible for the restoration of the Capitol building in to develop this full page graphic. Fairly quick turnaround. Good results.
LINK: https://goo.gl/LP3Mpj
Created with Adobe Illustrator and Adobe Photoshop

This piece mixed an infographic and a feature story headline in a really interesting way. One of my favorites. (Special thanks to Jerry Mosemak at https://www.behance.net/jmosemak for the texture assist.)
Created with Adobe Illustrator and Adobe Photoshop

This was a one-day "Design Jam" graphic for the USA Today Network focusing on three U.S. cities and what "local food" means to them. I wanted to keep the art flat and simple so that the charts stood out. This was a small team effort with me wearing as designer, researcher and copywriter hats.
LINK: https://goo.gl/EpcS7G
Created with Adobe Illustrator

Spies are Us. This infographic ran along side an interview of real live spy, Peter Earnest (Executive Director of the International Spy Museum). The graphic mixes notable milestones in spying history with state of the art spy gear of the time.
LINK: https://goo.gl/ZfFCNS
Created with Adobe Illustrator and Adobe Photoshop

See how close we are? This quick-turn infographic shows that both Red staters and Blue Staters agree that the lowly sandwich is the best thing to have for lunch.
Created with Adobe Illustrator

Marketing infographic touting the services of a Digital Marketing and SEO company.
LINK: https://goo.gl/wNxdkF
Created with Adobe Illustrator

Flowchart illustrating the unexpected effects of drought conditions and how they effect us all.
LINK: https://goo.gl/g2MSh2
Created with Adobe Illustrator

This was one of my favorite-ever graphics to create. There was lots of information to work with, and since the subject matter is light-hearted, I tried to have as much fun as I could, adding little touches that will be familiar to the average music festival goer.
LINK: https://goo.gl/ovsy7P
Created with Adobe Illustrator
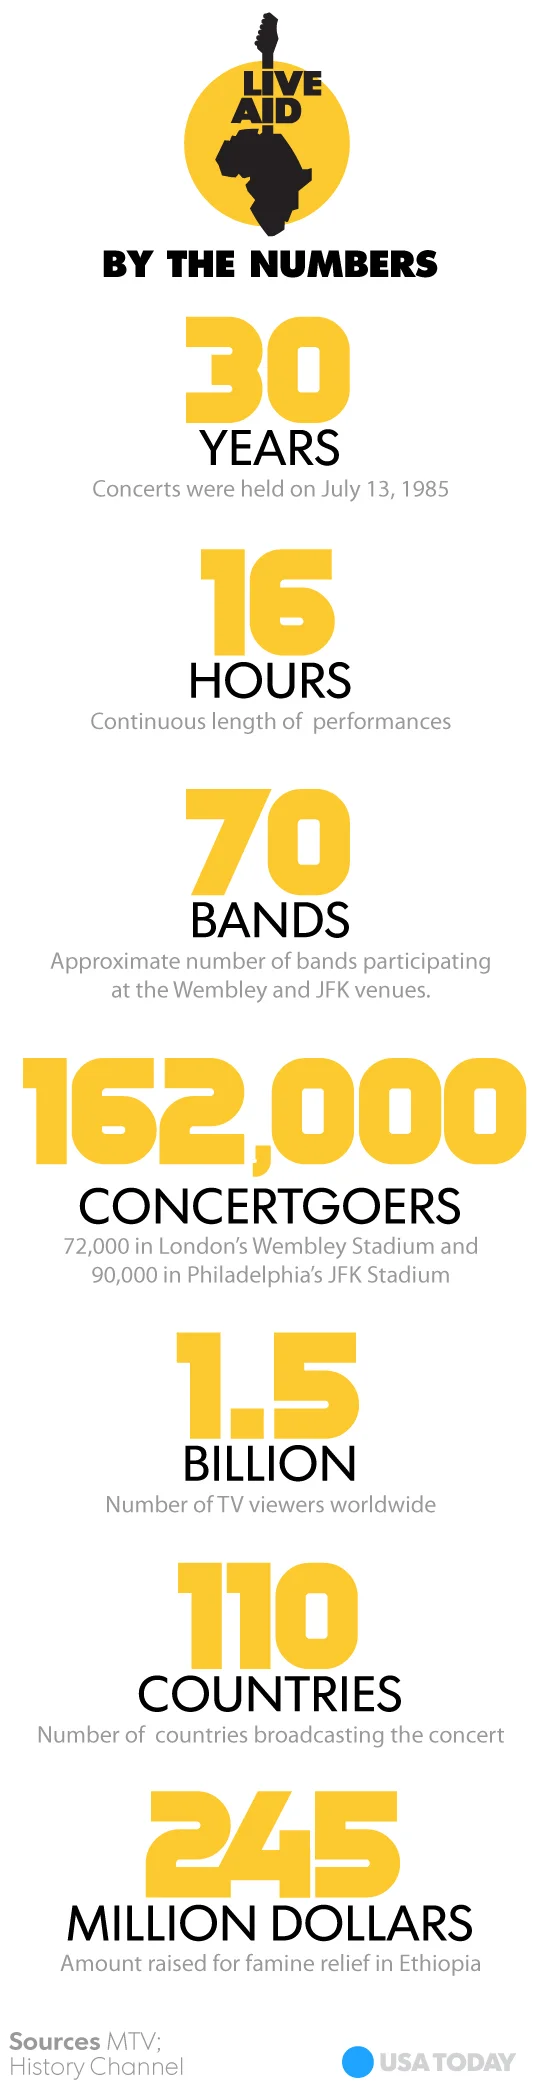
Live aid: 30 Years Later(if you can believe it...) This was a quick turnaround numbers graphic that accompanied a "look back" story.
LINK: https://goo.gl/e1mXqj
Created with Adobe Illustrator

Here is an example of an icon-based numbers graphic that shows just enough information to keep you interested.
Created with Adobe Illustrator

Infographic as game. Another fun one! Here I took a stale yearly traffic forecast and turned it into something you actually want to interact with. Who says stifling holiday traffic can't be fun?
LINK: https://goo.gl/YxUKqk
(Original published artwork was Flash-based interactive.)
Created with Adobe Illustrator and Adobe Flash

Let's get digital. This was a one-day "Design Jam" graphic for the USA Today Network. This was a small team effort with me wearing as designer, researcher and copywriter hats.
LINK: https://goo.gl/pJ7iTb
Created with Adobe Illustrator

Your favorite toys. This was a one-day "Design Jam" graphic for the USA Today Network. This was a small team effort with me wearing as designer, researcher and copywriter hats.
LINK: https://goo.gl/5Uy7BR
Created with Adobe Illustrator and Adobe Photoshop

Boo! this was a fun exercise in making a list interesting and festive. I really like this one too.
LINK: https://goo.gl/AwQvxd
Created with Adobe Illustrator

Hello Dolly. This was a one-day "Design Jam" graphic for the USA Today Network. This was a small team effort with me wearing as designer, researcher and copywriter hats.
LINK: https://goo.gl/Ke23S5
Created with Adobe Illustrator

What is Bitcoin? This graphic explains the difference between the almighty U.S. Dollar and this upstart currency.
LINK: https://goo.gl/bT8336
Created with Adobe Illustrator

Cupid or Stupid. This was a one-day "Design Jam" graphic for the USA Today Network. This was a small team effort with me wearing as designer, researcher and copywriter hats.
LINK: https://goo.gl/yyJry8
Created with Adobe Illustrator

Part of a series of travel pieces where a seasoned business traveller is selected to give their take on a city that they frequently travel to.
Created with Adobe Illustrator

Public service ad campaign for NRECA International teaching developing countries the medical benefits of electrification.
Created with Adobe Illustrator

"Beyond the Banner" ad treatment for the front page of USA TODAY.
LINK: https://goo.gl/M3aiFw